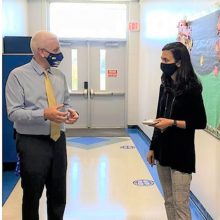
“Our students are more than test scores,” said Erin Swanson, director of innovation for Edgecombe County Public Schools, to a group of community members and educators gathered at Tarboro Brewing Company.
That belief — that student success should be measured by more than the results of a standardized test — was part of the impetus behind a four-week IBM Service Corps project concluding last week. For four weeks, 12 IBM executives scraped, cleaned, and integrated student-level data from the North Phillips School of Innovation. They created a dynamic dashboard that allows teachers and administrators to monitor comprehensive student data, including things like attendance, behavior, and social-emotional skills. Along the way, the IBM team learned about the challenges and opportunities of working with education data that is often siloed across multiple platforms and tricky to integrate.
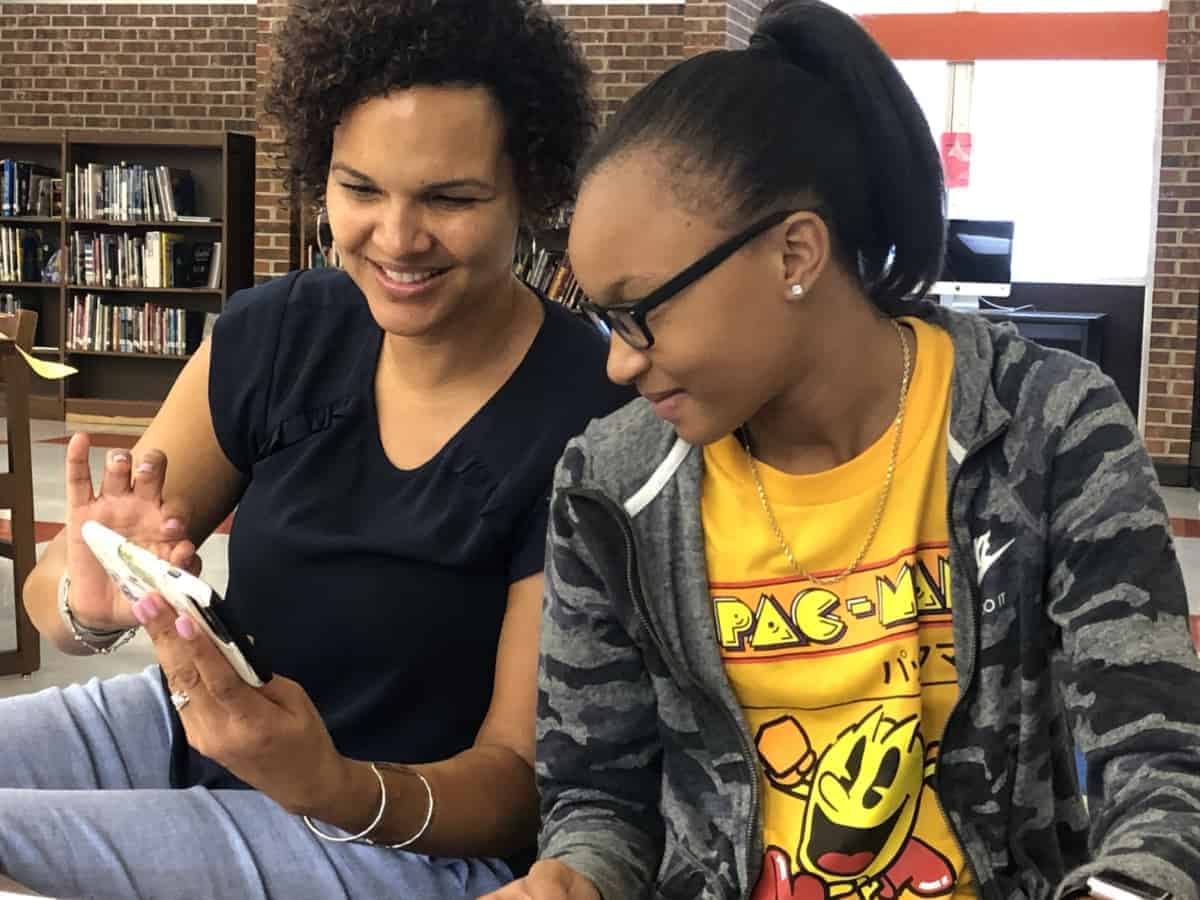
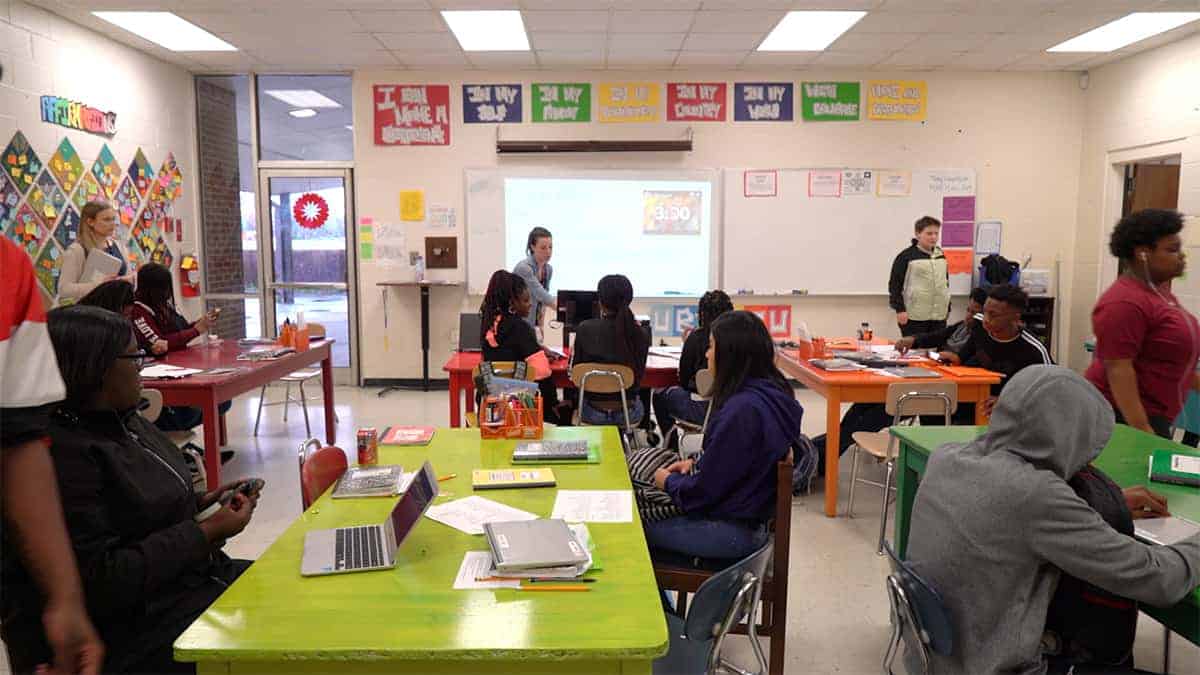
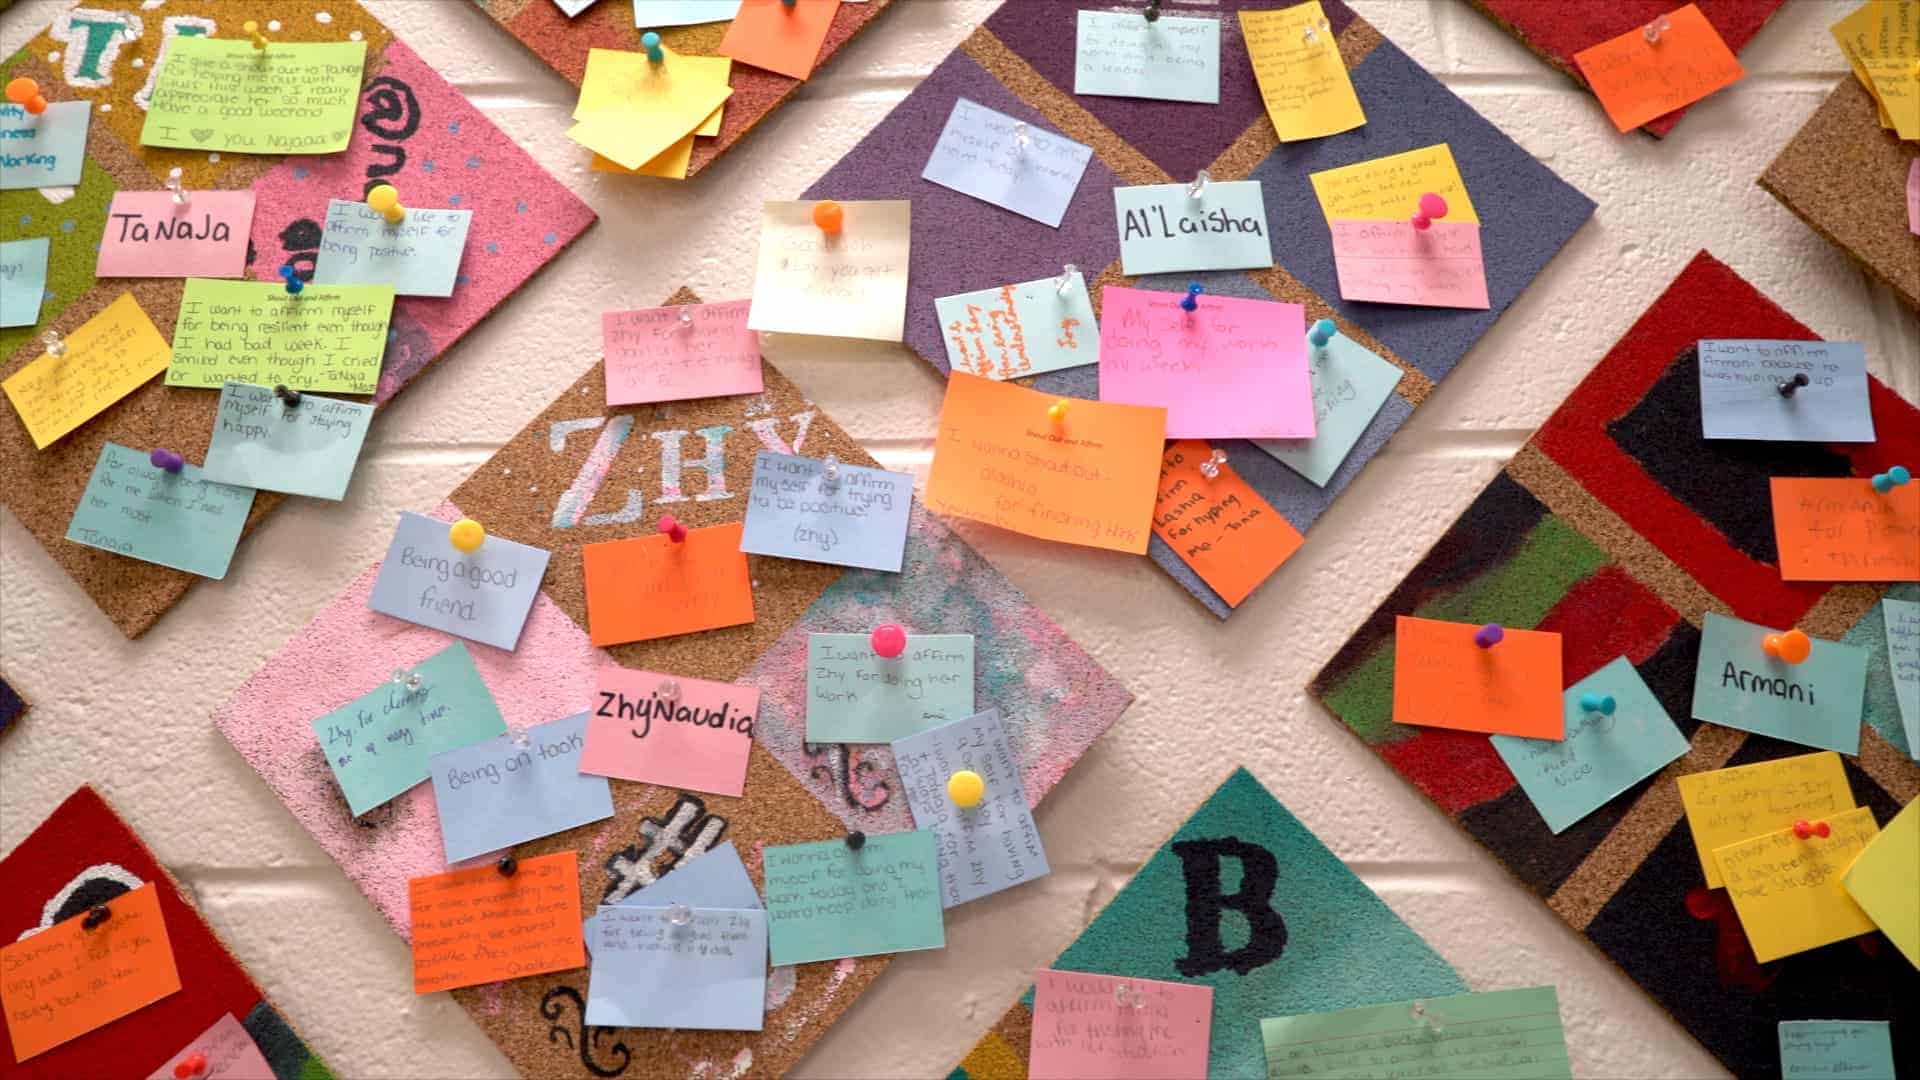
The idea for the project was born after the North Phillips School of Innovation concluded its pilot year as a “micro school” in the 2018-19 school year. In the School of Innovation, students experienced social-emotional support, reflected on their goals, and affirmed the successes of others in the space. They worked on interdisciplinary passion projects every day in design labs and standards labs. And they became the architects of their own identities, taking charge of their agency in the world. This year, every eighth, ninth, and 10th grader in the Northside feeder pattern has practices from the School of Innovation incorporated into their school days.
As the story of the school made its way across North Carolina, people wondered: How do we measure the impact of innovation? What difference is it really making for the students, for the school, and for the community?
But current models of school data and accountability aren’t equipped to measure many of the things that the school wants to foster in its students — things like a sense of belonging and social awareness — alongside other factors like attendance, behavior, and academic achievement. Without connecting all of those dots, there was no way for teachers to assess the impact of what was happening in the classroom on a comprehensive set of student outcomes. That’s where the IBM Service Corps team stepped in.
To learn more about the North Phillips School of Innovation, click here.
The process
The IBM team faced no easy feat. In four weeks, they had to get to know the Edgecombe County community, understand what students and educators wanted from the data tool, conduct multiple rounds of stakeholder interviews, and ultimately scrape, clean, and integrate data from multiple sources. Along the way, IBM Service Corps members implemented design thinking methodologies, engaged in community service, shared the story of the project on social media, and developed various training guides to ensure the tool was passed off successfully after the project concluded.
Priorities for the project included creating a student snapshot dashboard that would integrate things like discipline data, academic data, attendance data, EVAAS data, and data on social-emotional learning from a tool called Panorama. Educators also wanted to test their hypotheses that 1) students in the North Phillips School of Innovation have higher rates of attendance, lower rates of discipline, and stronger academic achievement, and 2) students with stronger social-emotional competencies have those same outcomes too.
Both of those priorities — creating a student snapshot dashboard and testing those hypotheses — required an intricate, multi-step process. The IBM team extracted more than 30 files from five data sources (including PowerSchool, EVAAS, Panorama, Educators Handbook, and Case 21), analyzed the data for errors and consistency, created seven custom scrubbers to prepare and clean the data in each of those files, created nine integrated data sets on Google Sheets, consolidated that data in the cloud, created seven dashboard pages in Google Data Studio to visually display the data, and ultimately navigated those dashboards to make insights.
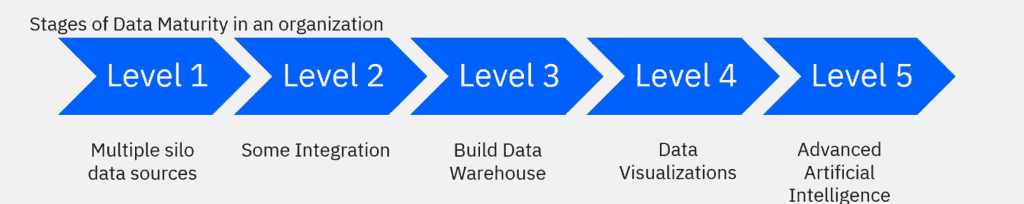
The IBM team attributed much of this cumbersome process to data maturity — or how integrated and accessible an organization’s data is. Data in Edgecombe County Public Schools is considered level one out of five in data maturity, with multiple siloed data sources that can’t interact. This analysis by the IBM team did not come as a surprise to district officials, who recognized that limited resources, technology, and expertise result in little capacity to integrate and leverage data in the way that the IBM team was able to.
As the IBM team worked to process the school’s data from level one to level four — the point at which data visualizations are possible — there were challenges at each step. For example, in one of the data sources, there were multiple student identification numbers assigned to one student. Within that source, that doesn’t pose a problem — but when the IBM team went to merge multiple data sources to begin making deeper insights, issues arose. Over the course of the project, the team was unable to mitigate this problem. While it didn’t completely limit their use of that data source, it did limit the amount of data the team was able to leverage from that source.
To improve data maturity in the future, the IBM team recommended that the district assign a district-level data steward, develop a data quality improvement plan, and engage with data holders to clean the core data at the source.
The results
Despite challenges along the way, the IBM team was able to create the student snapshot dashboard and test the hypotheses originally laid out in the project plan. The dashboard is dynamic and allows users to filter for different variables like time frame, grade level, and even by individual students. In one place, a teacher can view all of the data for a given student — including their benchmark exam scores, attendance and discipline records, and social-emotional competencies — over the course of multiple years. And, at each level of the dashboard, students in the School of Innovation can be compared to students that were not in the School of Innovation, allowing for educators to better understand the unique impact of the model.
The following findings from the dashboard quantify the impact of the North Phillips School of Innovation (NPSI) in a new way, offering insights that were previously unavailable. Here are a few of the key findings.
Attendance
North Phillips School of Innovation students have higher attendance rates on average than non-NPSI students in the same grade levels. In the 2018-19 school year, students in the North Phillips School of Innovation had an attendance rate that was 3% higher, on average, than their peer group in the same grade level.
Discipline
NPSI students have lower rates of discipline compared to non-NPSI students in the same grade levels. While NPSI students accounted for about 30% of the 8th and 9th grade students in the 2018-19 school year, those students only accounted for 19% of incidents and 21% of offenders in the school.
Social-emotional competencies
Results from Panorama surveys on student support and the school environment showed that NPSI students had a higher sense of school safety and a higher sense of belonging than other students in the same grades. Results from Panorama surveys on student competencies showed that NPSI students had higher levels of self-management and social awareness than other students in the same grades.
Correlations
The team also examined the associations between Panorama metrics (like school safety, a sense of belonging, and social-emotional competencies) and student attendance, discipline, and academic achievement.
Due to the cleanliness of attendance data, the IBM team found a statistically significant association between social-emotional competencies and attendance rates, as well as between a sense of school safety and attendance rates.
The case was similar with school discipline data. There was a statistically significant association between a sense of school safety and discipline outcomes.
The academic achievement dimension was more challenging to assess due to inconsistent student identification numbers, rendering it difficult to make links between achievement data and Panorama data. While the IBM team was able to find some descriptive insights about academic achievement, they were unable to find statistically significant insights as they did with attendance and discipline.
The IBM team concluded the project by providing trainings and resources on the dashboard, allowing educators at North Edgecombe High and Phillips Middle to continue upkeep on the dashboard by manually uploading new student data as it becomes available.
This data inquiry in one of North Carolina’s 115 school districts has us wondering about the state of data in schools and districts across the state, and what it would take for all of the districts to have access to an integrated dashboard with clean student data. We also want to explore expanding the student dashboard to allow for student input on everything from access to food and healthcare to documenting student voice and leadership.