This is an excerpt from “E(race)ing Inequities: The State of Racial Equity in North Carolina Public Schools” by the Center for Racial Equity in Education (CREED). Go here to read the full report and to find all content related to the report, including the companion report Deep Rooted.
Honors courses, as distinguished from standard level courses, are intended to provide students with more rigorous and challenging coursework. According to the NC State Board of Education [GRAD-009, High Schools Transcript Standard; NC GS 116-11(10a)], “(c)ourse content, pace and academic rigor place high expectations on the student, demanding greater independence and responsibility. Such courses are more challenging than standard level courses and are distinguished by a difference in the depth and scope of work required to address the NC Standard Course of Study.”
In 2004, the North Carolina State Board of Education approved the Honors Implementation Framework (HIF) for the development and implementation of honors courses in the state. A revised framework was approved in 2013. The goal of the framework was to guide the development and evaluation of honors courses and to ensure fidelity of implementation across the state. Honors level courses may be developed in any content and subject area. There are currently over 500 honors level courses offered in public schools across the state. While the HIF requires periodic reviews by local administrators, honors courses are developed, implemented, and evaluated on the local level, with little oversight from state officials.
Along with Advanced Placement, International Baccalaureate, and some advanced math and foreign language courses, honors courses are positioned by the State Board as an indicator of greater curricular rigor. Effective with the freshman class of 2015-16, an additional one-half (.5) of a quality point is added to the grade earned in honors courses. Before the 2015-2016 freshman class, an A in an honors course garnered five quality points while an A in a regular course only awarded the student four quality points. In other words, the additional quality point for honors courses meant that a B in an honors course was the equivalent of an A in a regular course. Under the new rules, students only receive four and a half quality points for an A in an honors course.1
The weighting of honors course grades affects grade point average calculations and class rankings. Therefore, like other advanced courses, performance in and exposure to honors courses influences students’ favorability when being considered for admission to competitive colleges and universities.
Methodology
In this report, we analyze honors level courses as an indicator of both achievement outcomes and access to rigorous coursework. We report descriptive statistics on the total number of honors courses taken and the number of students that took at least one honors course as a factor of race/ethnicity as well as the average number of honors courses taken by racial/ethnic group. We also assess whether race/ethnicity is a significant predictor of honors course-taking, and whether any detected effect of race/ethnicity remains significant after controlling for gender, socioeconomic status, language status, special education status, and giftedness. Finally, as an indication of differential exposure to rigorous advanced coursework, we assess the relationship between the number of honors courses offered and the proportion of students of color at the school level.
Approximately 285,000 students took roughly 747,000 honors courses in North Carolina public schools in 2016-2017. Students took between 1 and 11 honors courses, with a mean number of courses taken of 2.78.
Analysis
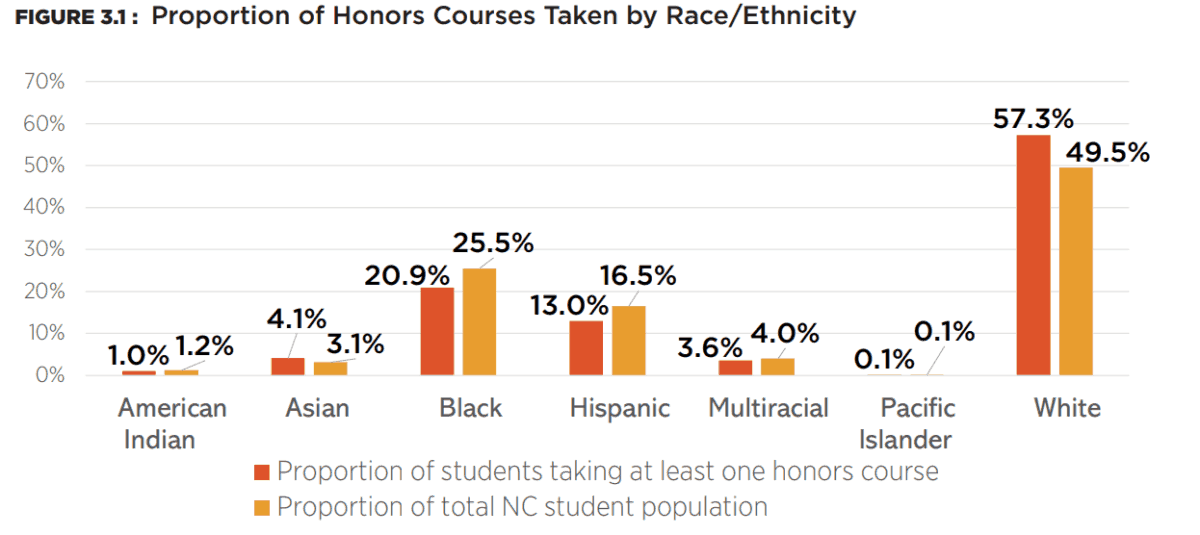
Figure 3.1 shows the proportion of students that took at least one honors course as a factor of race/ethnicity and how that compares to each racial/ethnic groups’ proportion of the statewide student population. Asian and White students are over-represented in honors course-taking, while Black, Hispanic, American Indian, and Multiracial students are under-represented. Pacific Islanders are proportionally represented. These racial/ethnic differences are statistically significant and thus unlikely to be due to chance. Furthermore, they allow us to consider what proportional representation would look like in practical terms for each racial/ethnic group. For instance, Black students in North Carolina would have taken over 2,700 additional honors courses if they were proportionally represented in honors course taking.
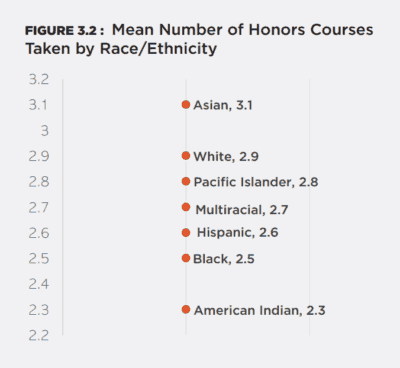
A similar pattern is present when we examine the mean number of honors courses taken by race/ethnicity. Among students who took at least one honors course, Asians and Whites averaged 3.1 and 2.9 courses respectively. The remaining racial/ethnic groups averaged between 2.3 and 2.8 honors courses (See Figure 3.2). These differences were also statistically significant.
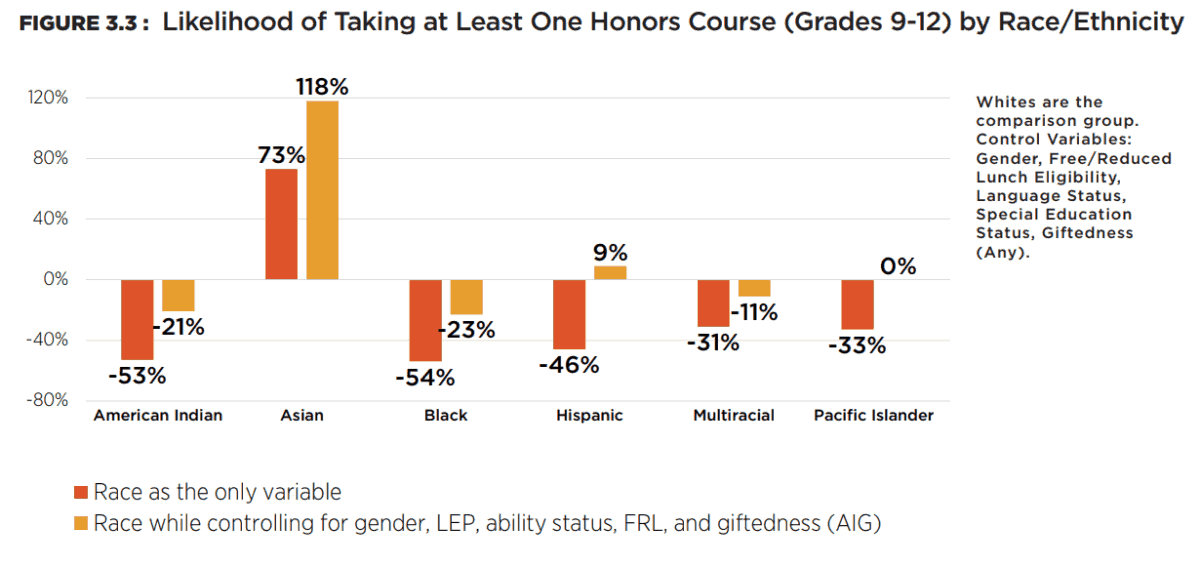
We also analyzed all North Carolina students in grades 9-12 to determine whether race/ethnicity had a unique effect on taking at least one honors course when controlling for other potentially relevant factors.
Model 1 represents the likelihood of taking at least one honors course for each racial/ethnic group as compared to White students. Model 2 shows the likelihood for each group while controlling for gender, free/reduced lunch status, language status, and giftedness (AIG).
Race/ethnicity was a significant predictor for all racial groups (as compared to Whites) in Model 1, such that Asians were more likely than Whites to take honors courses while other student groups of color were less likely. In Model 2, the likelihood of Asians taking at least one honors course compared to Whites increased even further. Pacific Islanders were no longer significantly different than Whites. Interestingly, the likelihood of Hispanics taking at least one honors course compared to Whites changed both direction and magnitude once control variables were added. Net of other factors, Hispanics were slightly more likely than Whites to take at least one honors course. American Indian, Black, and Multiracial students remained substantially less likely than Whites to take at least one honors course. The disparity was largest for Black students, such that Black students were 23% less likely than White students to take an honors course after controlling for other factors. Approximately 20,000 more Black students would have taken at least one honors course if they participated in honors courses at rates similar to White students.
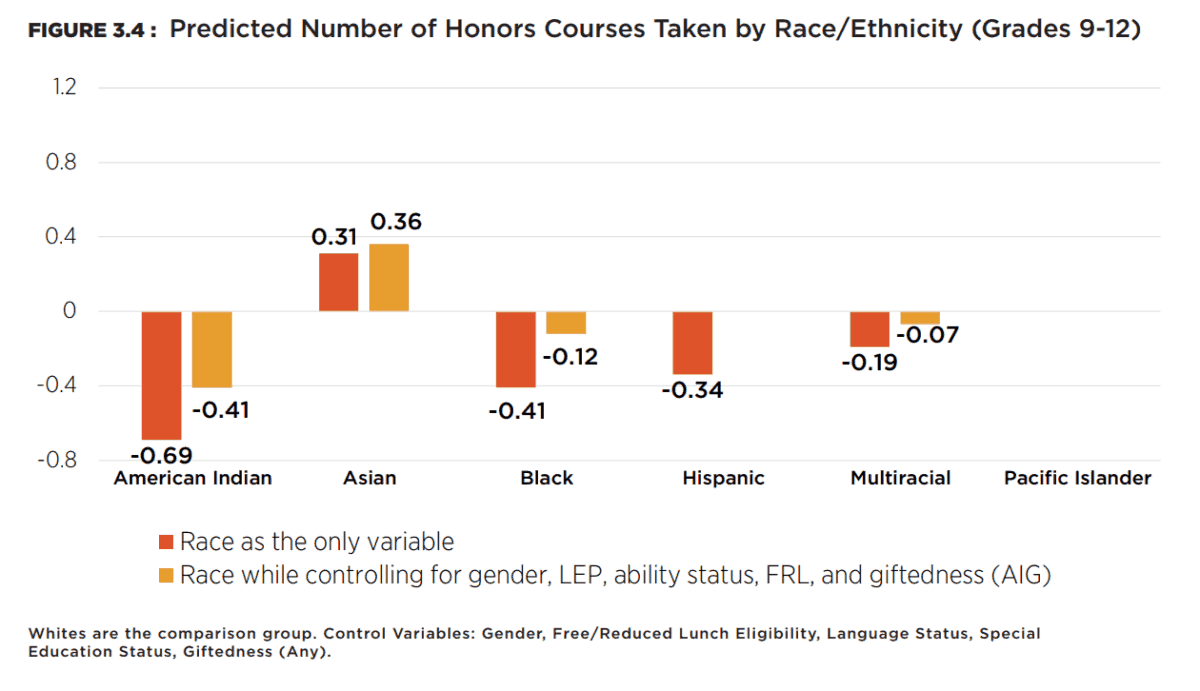
We conducted a similar analysis for the average number of honors courses taken. With White students as a comparison group, we predicted the number of honors courses taken for each student group of color while controlling for gender, language status, special education status, socioeconomic status, and giftedness (AIG). Race/ethnicity was a significant predictor of the number of honors courses taken for all student groups of color (compared to Whites) except for Pacific Islanders. Holding other factors constant, our model predicted that Asian students would average .36 more honors courses, Multiracial students would average .07 fewer, Black students would average .12 fewer, and American Indian students would average .41 fewer honors courses than White students in the state. Hispanics and Pacific Islanders had predicted averages similar to those for Whites when controlling for other factors.
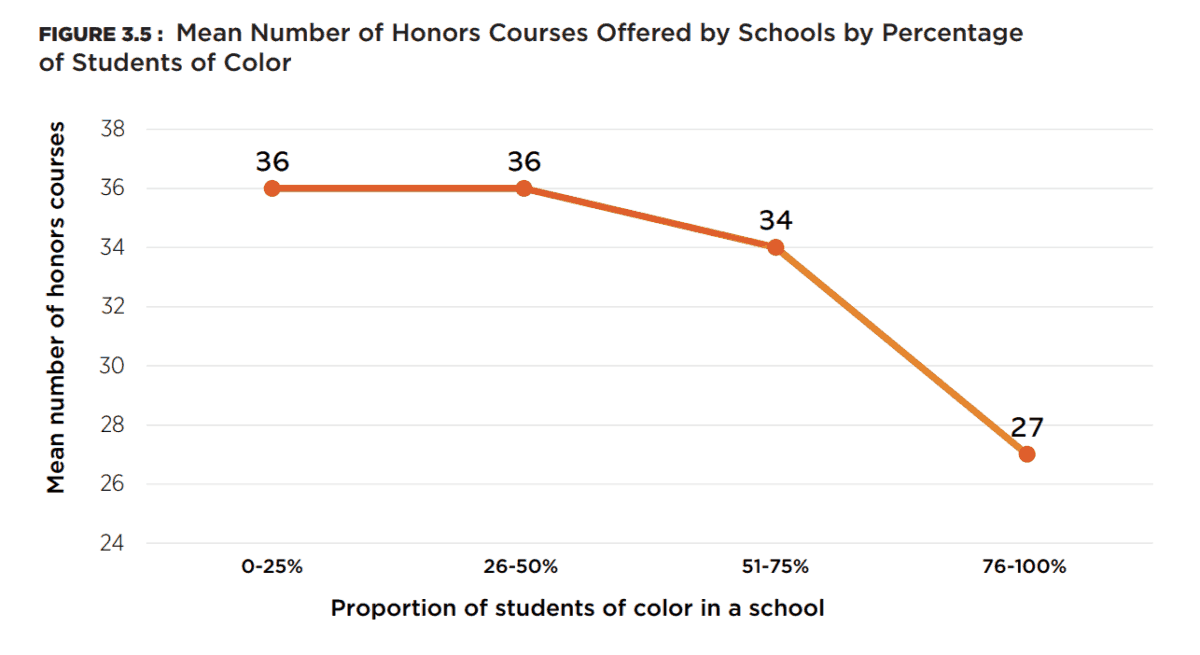
Our analysis also included comparisons of the number of honors courses offered by schools as a factor of racial/ethnic composition. In other words, do schools with higher concentrations of students of color (SOCs) offer fewer honors courses? The answer is a resounding yes. If we split all the schools that offered at least one honors course into quartiles by the proportion of SOCs, we find that schools in quartiles 1 (0-25% SOCs) and 2 (26-50%) offer an average of 36 honors courses. Schools with 51-75% SOCs average 34 honors courses, and schools with the highest number of SOCs (76-100%) offer an average of 27 honors courses.
Furthermore, while the aggregated differences between schools based on the proportion of SOCs was statistically significant (p < .05), all of the substantial difference was accounted for by differences between high SOC schools (76-100%) and those with lower proportions of SOCs. In other words, the observed differences between the average number of honors courses offered by schools in the first three quartiles (0-25%, 26-50%, and 51-75% SOCs) were no different than what might be expected from chance, while schools with the highest proportion of students of color (76-100%) offered significantly and substantially fewer honors courses than their White counterparts.
Takeaways
This analysis demonstrates that non-Asian students of color in aggregate do not have equitable access to or achievement in honors courses in North Carolina public schools. To the extent that honors courses represent rigorous, college preparatory coursework, non-Asian students of color may be unlikely to finish high school with the same level of preparedness as their White and Asian counterparts. A similar pattern was observed for Advanced Placement courses. As is the case with AP courses, the rigor and fidelity of honors coursework is debated by scholars (Adelman, 2006; Camara & Michaelides, 2005; Geiser & Santelices, 2006; Gonzalez, O’Connor, & Miles, 2001). However, North Carolina schools are required to give additional weight to honors courses when calculating grade point averages (GPA). Postsecondary institutions also look favorably upon honors course taking. Thus, honors course taking remains an important component of the admissions criteria for colleges and universities. It is also worth noting that the patterns of honors course offerings found in this analysis suggest that a reduction in the access of students of color to honors courses has likely been an underappreciated side effect of the school re-segregation observed in many of NC’s largest school districts over the last two decades (Clotfelter, Ladd, & Vigdor, 2002).
References
Adelman, C. (2006). The toolbox revisited: Paths to degree completion from high school through college. Washington, D.C.: U. S. Department of Education.
Camara, W., & Michaelides, M. (2005). AP use in admissions: A response to Geiser and Santelices. New York, NY: College Board. Retrieved January, 12, 2006. https://pdfs.semanticscholar.org/31e2/921ee01985d84f6f84cc04a538f52a31eabe.pdf
Clotfelter, C. T., Ladd, H. F., & Vigdor, J. L. (2002). Segregation and resegregation in North Carolina’s public school classrooms. North Carolina Law Review, 81, 1463
Geiser, S., & Santelices, V. (2006). The role of advanced placement and honors courses in college admissions. Expanding opportunity in higher education: Leveraging promise, 75114.
Gonzalez, E. J., O’Connor, K. M., & Miles, J. A. (June 2001). How well do Advanced Placement students perform on the TIMSS Advanced Mathematics and Physics tests? Technical Report of the International Study Center, Lynch School of Education at Boston College. Boston, MA: International Study Center.
Kretchmar, J., & Farmer, S. (2013). How Much is Enough? Rethinking the Role of High School Courses in College Admission. Journal of College Admission, 220, 28-33. https://files.eric.ed.gov/fulltext/EJ1011884.pdf
Editor’s note: James Ford is on contract with the N.C. Center for Public Policy Research from 2017-2020 while he leads this statewide study of equity in our schools. Center staff is supporting Ford’s leadership of the study, conducted an independent verification of the data, and edited the reports.