This is an excerpt from “E(race)ing Inequities: The State of Racial Equity in North Carolina Public Schools” by the Center for Racial Equity in Education (CREED). Go here to read the full report and to find all content related to the report, including the companion report Deep Rooted.
Exceptional children (EC) are those receiving special education and related services. EC students are covered under the federal Individuals with Disabilities Education Act (IDEA), which mandates a free and appropriate public education for eligible students ages 3–21. Several other federal provisions and numerous state statutes, including NC 1500-1508, also cover EC students. Eligible students are those identified by a team of professionals as having a defined disability that adversely affects academic performance and as being in need of special education and related services. At the school and LEA level, the education of EC students is guided by an Individual Educational Program (IEP), which is developed, reviewed, and revised by a team typically consisting of an LEA representative, a parent of the child with a disability, a regular education teacher of the child, a special education teacher of the child, and others as required by state or federal law (NC 1503-4.2).
Exceptionality is difficult and complex to research because of the amount of federal and state legislation involved, the number of and wide variation among legally defined disabilities, the challenges of quantifying differential representation within populations often characterized by small sample sizes, and the difficulty of avoiding positioning those traditionally considered “able” as the standard to which the full variation in human ability is implicitly compared (Albrecht, Skiba, Losen, Chung, & Middleburg, 2012 ). Furthermore, research on the intersection of exceptionality and race/ethnicity is in a state of flux. For decades, much of the research focused on the over-representation of students of color among exceptional children; the historical, racial, and cultural factors embedded in conceptions of (dis)abilty; and the ways that exceptionality designations can be used to deny historically disadvantaged students the full benefit of public education (Skiba, Poloni-Staudinger, Simmons, Feggins-Azziz, & Chung, 2005; Sullivan & Bal, 2013; U.S. Department of Education Office of Civil Rights, 2016; Zhang Katsiyannis, Ju, & Roberts, 2014.)
However, recent research using different methodological approaches has suggested that students of color are under-represented among exceptional children when appropriate statistical controls are applied (Morgan, Farkas, Hillemeier, & Maczuga, 2017; Morgan Farkas, Hillemeier, Maczuga, Li, & Cook, 2015). Both sides have vigorously defended their methods and conclusions while others have called for a broader paradigm shift in (dis)ability research that reexamines the meaning of (dis)ability and pays more attention to the voices and lived experiences of those labelled as “disabled” (Cavendish, Connor, Gonzalez, Jean-Pierre, & Card, 2018).
In this report, we position exceptionality as an indicator of access and opportunity. While the question of whether or not students of color are over- or under-represented in special education on an aggregate level remains disputed, the literature provides ample evidence of a strong relationship between student race/ethnicity, special education, and educational outcomes (Donovan & Cross, 2002; Hosp & Reschly, 2004; Lazarus, Albus, & Thurlow, 2016). Research has found that participation in special education programs significantly boosts the academic achievement of special education students (Hanushek, Kain, & Rivkin, 2002). Separate analysis in this report indicates that both race/ethnicity and exceptionality have significant and substantial effects on graduation and dropout. Studies in public health and education have suggested that race/ethnicity affects identification and treatment for disabilities even among children presenting similar clinical needs (Flores & The Committee for Pediatric Research, 2010; Gillborn, Rollack, Vincent, & Ball, 2016).
Research has also documented relationships between special education designations and factors like service provider bias, cultural or language factor barriers, racial/ethnic prejudice and stigma, broader social inequities in health care access and insurance, and racially segregated and under-resourced schools (Flores & Tomany-Korman, 2008; Hall et al., 2015; Inkelas, Raghavan, Larson, Kuo, & Ortega, 2007; Zuckerman, Mattox, Sinche, Blaschke, & Bethell, 2014). This body of literature makes it clear that racial inequities in health and health care are likely to be reflected in special education designation patterns within public schools. Furthermore, it illuminates how racial prejudice, discrimination, and stigma contribute to the observed inequities in health, health care, and special education services.
There is also substantial evidence of racial differences within disability classifications, particularly among more subjective classifications, i.e. learning disabled, behavioral/emotional disability, developmental delay, and intellectual disability (Hibel, Farkas, & Morgan, 2010). Racial disparities have been detected in the level of segregation from non-disabled peers as well (National Council on Disability, 2018).
Methodology
Approximately 6.4 million students (13%) were served under IDEA in the United States in 2015-2016 (National Center for Educational Statistics, 2017; U.S. Department of Education, 2017). Nationally, the percentage of students served under IDEA was highest for those who were American Indian/Alaska Native (17%), followed by those who were Black (16%), White (14%), Multiracial (13%), Hispanic and Pacific Islander (both at 12%), and Asian (7%) (National Center for Educational Statistics, 2017; U.S. Department of Education, 2017).
We analyzed data from over 200,000 K-12 North Carolina public school students receiving special education services in 2016-2017. EC accounted for just over 13% of all K-12 students statewide, mirroring the national percentages noted above.
Analysis
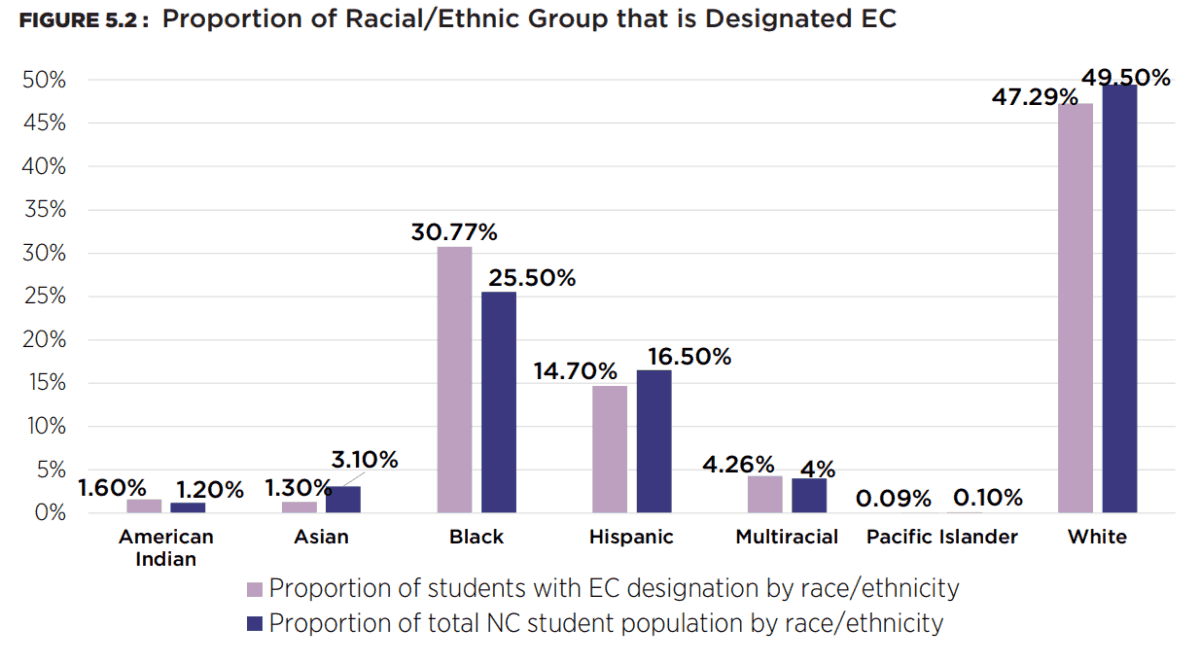
Figures 5.1 and 5.2 show the number of EC students by race/ethnicity, the percentage of each racial group that was designated EC, the proportion of all EC students represented by each racial group, and the proportion of all North Carolina students represented by each racial group.
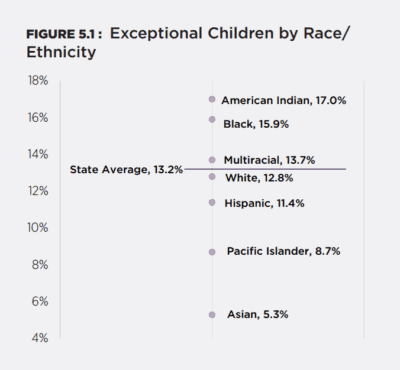
American Indians had the highest rate of EC (17%). The proportion of Black (15.9%) and Multiracial (13.7%) EC students also exceeded the state average of 13.2%. Asian (5.3%) and Pacific Islander (8.7%) students were well below the state average of EC students. Hispanic (11.4%) and White (12.8%) students were also below the state average. American Indian, Black, and Multiracial students were over-represented in EC as compared to their proportion of all North Carolina students, while Asian, Hispanic and White students were under-represented. Pacific Islander students were proportionally represented as compared to their proportion of all North Carolina students.
To further test the association of race/ethnicity with EC designation, we built prediction models that indicated the effect of race/ethnicity after controlling for gender, free/reduced lunch eligibility, language status, and giftedness. In Figure 5.3, Model 1 shows the likelihood of being designated EC for each racial/ethnic group as compared to White students in the state as a factor of race/ethnicity only, and Model 2 shows the net effect of race/ethnicity when controlling for other factors.
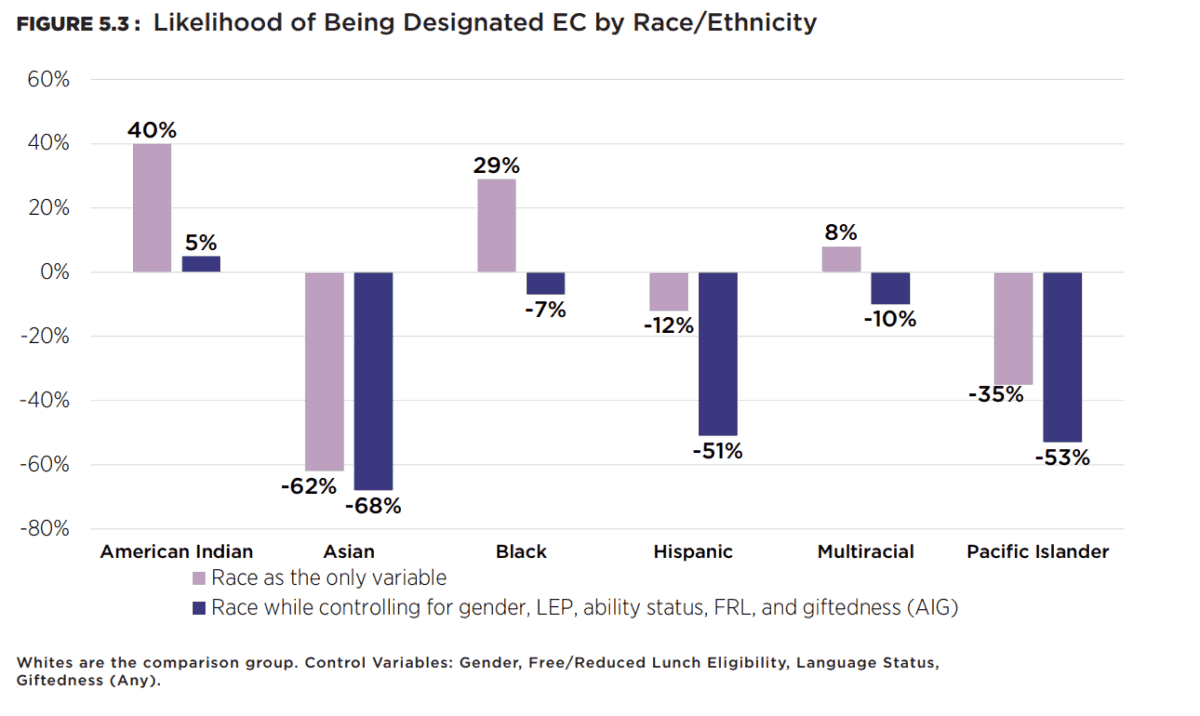
With race/ethnicity as the only predictor, American Indian, Black, and Multiracial students had a significantly higher likelihood of carrying an EC designation as compared to White students. The likelihood of being EC for Asians, Hispanics, and Pacific Islanders was significantly lower as compared to Whites with race/ethnicity as the sole factor.
However, controlling for gender, free/reduced lunch eligibility, language status, and giftedness changes the results dramatically. Net of those factors, the model (Model 2) predicted that only American Indian students are more likely than Whites to be classified as EC. While the result for American Indian students is statistically significant (p<.05), the magnitude is quite small, suggesting that the difference in EC designation between American Indian and White students may be of little substantive significance. The change in direction and/or magnitude for Black and Hispanic students was particularly large. This was likely related to the considerable strength of language status and free/reduced lunch eligibility in the model. Limited English Proficient (LEP) students were 106% more likely to be classified as EC than non-LEP students, and students eligible for free/reduced lunch were 68% more likely to be classified as EC than non-free/reduced lunch eligible students. Given that Hispanic students tend to be over-represented among Limited English Proficient and both Black and Hispanic students tend to be over-represented among free/reduced lunch eligible students, it makes sense that controlling for the influence of those factors would reduce the likelihood of EC designation for both racial/ethnic groups. Overall, the analysis indicates that, net of other factors, students of color were generally less likely to be designated EC than White students in the state.
To further parse the relationship between student race/ethnicity and EC, we analyzed the 18 exceptionality classifications1 used in coding special education in North Carolina. Special education research classifies certain EC designations as judgmental (i.e. developmentally delayed, behaviorally/emotionally disabled, intellectual disability, learning disabled) and others as medically-defined (i.e. blindness, visual impairment, hearing impaired) (Hibel et al., 2010). See Appendix A, Table 4 for a complete listing of judgmental and medically-defined designations. Physicians rarely diagnose judgmental disabilities. Instead, teachers typically refer students for evaluation based on classroom behavior and/or academic performance. The referral process often leads to teacher and administrator consultation, psychological evaluation, examination of student records, and committee meetings that include parents (Donovan & Cross, 2002). Over half of special education referrals are thought to follow this pattern (Fugate, Clarizio, & Phillips, 1993, Gottlieb, Alter, Gottlieb, & Wishner, 1994). Teachers’ normative judgments of what constitutes acceptable achievement and/or behavior figure prominently in this process as does the school climate, which presumably influences the standards used in teachers’ judgments.
Figure 5.4 shows the proportion of students from each racial group that are considered to have the judgmental disabilities: developmentally delayed (DD), behaviorally/emotionally disabled (BED), intellectual disability (ID), or learning disabled (LD).
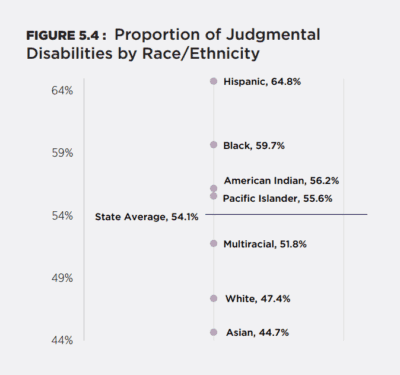
American Indian, Black, Hispanic, and Pacific Islander students have the highest proportions of judgmental EC classifications, all of which are above the state average (54.1%). Asian, Multiracial, and White students have proportions falling well below the state average.
As a final way to assess the relationship between race/ethnicity and exceptionality, we examined the settings of EC students. Schools report a setting for each student with a disability. While there are numerous settings, we were interested in whether the degree to which students are separated from non-disabled peers varied across racial groups. Table 5.1 shows the number of EC students in “regular” settings vs. “separate settings” and the percentage of students in a separate setting by racial group. A regular setting is one in which students spend over 80% of the school day with non-disabled peers. We considered separate settings to be those in which students spent less than or equal to 79% of the school day with non-disabled peers or attended separate residential facilities or schools.
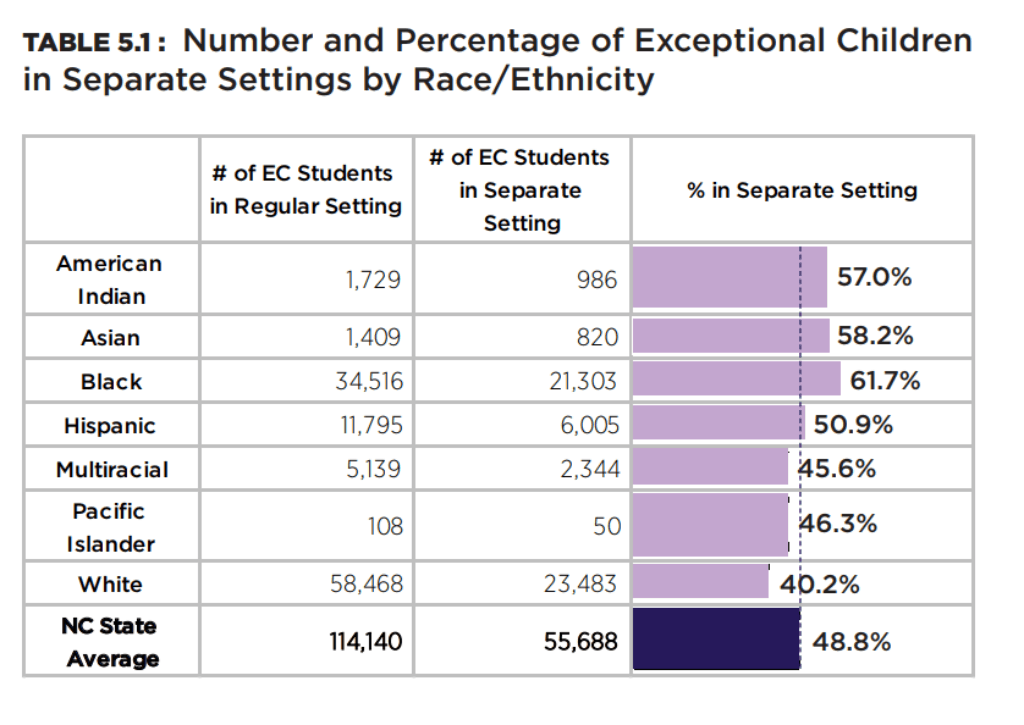
The average proportion of students in a separate setting statewide was 48.8%. Among the racial groups that exceeded the state average, Black students had the highest proportion of EC students in separate settings (61.7%), followed by Asian (58.2%), American Indian (57.0%), and Hispanic students (50.9%). Multiracial (45.6%), Pacific Islander (46.3%), and White students had separation rates below the state average, with Whites having the lowest overall rate of separation at 40.2%.
Takeaways
Our results show that substantial differences exist between racial groups in the context of special education in North Carolina. Race/ethnicity is a strong predictor of EC designation across all models. While American Indian, Black, and Multiracial students were over-represented among students designated EC overall, after controlling for potentially confounding factors, only American Indian students were slightly more likely to be designated EC than their White counterparts. These results support the more recent literature that suggests an under-representation of student groups of color in special education. However, students of color, particularly American Indian, Black, and Hispanic students, were over-represented in a subset of more subjectively defined judgmental disabilities and were separated from non-disabled peers at higher rates than White and Asian students.
The nuanced nature of our findings reflects the contested nature of the broader exceptionality literature. Our results and the theoretical framing of this report prioritize the need for a “both/and” rather than an “either/or” orientation in the context of exceptionality. Specifically, our findings suggest that where special education programming serves to benefit students (i.e. inclusion with non-disabled peers, programming to address medically diagnosed disabilities, and the support of higher achievement/attainment), White students are over-represented. Meanwhile, students of color tend to be over-represented where an exceptionality designation may represent an overexposure to educational risk factors (i.e. segregation from non-disabled peers, subjectively defined disability designations, and attendant constraints on achievement/attainment).
References
Albrecht, S. F., Skiba, R. J., Losen, D. J., Chung, C. G., & Middelberg, L. (2012). Federal policy on disproportionality in special education: Is it moving us forward? Journal of Disability Policy Studies, 23, 14–25.
Cavendish, W., Connor, D., Gonzalez, T., Jean-Pierre, P., & Card, K. (2018). Troubling “The Problem” of racial overrepresentation in special education: a commentary and call to rethink research. Educational Review, 1-16.
Donovan, M. S., & Cross, C. T. (2002). Minority students in special and gifted education. Washington, DC: National Academy Press.
Flores, G., & the Committee on Pediatric Research. (2010). Technical report: Racial and ethnic disparities in health and health care of children. Pediatrics, 125, e979–e1020.
Flores, G., & Tomany-Korman, S. C. (2008). Racial and ethnic disparities in medical and dental health, access to care, and use of services in US children. Pediatrics, 121, e286–e298.
Fugate, D. J., Clarizio, H. F., Phillips, S.E. (1993). Referral-to-placement ratio: A finding in need of Reassessment? Journal of Learning Disabilities, 26, 413–416.
Gillborn, D., Rollack, N., Vincent, C., & Ball, S. J. (2016). The Black middle classes, education, racism, and dis/ability: An intersectional analysis. In D. J. Connor, B. A. Ferri, & S. A. Annamma (Eds.), DisCrit: Disability studies and critical race theory in education (pp. 35–54). New York, NY: Teachers College.
Gottlieb, J., Alter, M., Gottlieb, B. W., Wishner, J. (1994). Special education in urban America: It’s not justifiable for many. The Journal of Special Education, 27, 453–465.
Hall, W. J., Chapman, M. V., Kent, M. L., Yeenia, M. M., Thomas, T. W., Payne, K., . . . Coyne-Beasley, T. (2015). Implicit racial/ethnic bias among health care professionals and its influence on health care outcomes: A systematic review. American Journal of Public Health, 105, e60-e76.
Hanushek, E. A., Kain, J. F., & Rivkin, S. G. (2002). Inferring program effects for special populations: Does special education raise achievement for students with disabilities?. Review of Economics and Statistics, 84(4), 584-599.
Hibel, J., Farkas, G., & Morgan, P. L. (2010). Who is placed into special education?. Sociology of Education, 83(4), 312-332.
Hosp, J. L., & Reschly, D. J. (2004). Disproportionate representation of minority students in special education: Academic, demographic, and economic predictors. Exceptional Children, 70, 185–199.
Inkelas, M., Raghavan, R., Larson, K., Kuo, A. A., & Ortega, A. N. (2007). Unmet mental health need and access to services for children with special health care needs and their families. Ambulatory Pediatrics, 7, 431–438.
Lazarus, S. S., Albus, D., & Thurlow, M. L. (2016). 2013-14 publicly reported assessment results for students with disabilities and ELLs with disabilities (NCEO Report 401). Minneapolis, MN: University of Minnesota, National Center on Educational Outcomes.
Morgan, P. L., Farkas, G., Hillemeier, M. M., & Maczuga, S. (2017). Replicated evidence of racial and ethnic disparities in disability identification in US schools. Educational Researcher, 46(6), 305-322.
Morgan, P. L., Farkas, G., Hillemeier, M. M., Maczuga, S., Li, H., & Cook, M. (2015). Are minority children disproportionately represented in early intervention and early childhood special education? Educational Researcher, 41(9), 339–351.
National Center for Education Statistics, Common Core of Data. (2017). State nonfiscal survey of public elementary/secondary education, 2015–16. Digest of Education Statistics 2017, Table 204.50.
National Council on Disability. (2018). The segregation of students with disabilities. Washington D.C.: National Council on Disability.
Skiba, R. J., Poloni-Staudinger, L., Simmons, A. B., Feggins-Azziz, L. R., & Chung, C. (2005). Unproven links: Can poverty explain ethnic disproportionality in special education? The Journal of Special Education, 39, 130–144.
Sullivan, A. L., & Bal, A. (2013). Disproportionality in special education: Effects of individual and school variables on disability risk. Exceptional Children, 79, 475–494.
U.S. Department of Education Office of Civil Rights. (2016). Dear colleague letter: Preventing racial discrimination in special education. Retrieved from https://www2.ed.gov/about/offices/list/ocr/letters/colleague-201612-racedisc-special-education.pdf
Zhang, D., Katsiyannis, A., Ju, S., & Roberts, E. (2014). Minority representation in special education: 5-year trends. Journal of Child and Family Studies, 23, 118–127.
Zuckerman, K. E., Mattox, K. M., Sinche, B. K., Blaschke, G. S., & Bethell, C. (2014). Racial, ethnic, and language disparities in early childhood developmental/behavioral evaluations: A narrative review. Clinical Pediatrics, 53, 619–631.
Editor’s note: James Ford is on contract with the N.C. Center for Public Policy Research from 2017-2020 while he leads this statewide study of equity in our schools. Center staff is supporting Ford’s leadership of the study, conducted an independent verification of the data, and edited the reports.