This is the fourth piece in a week-long series on schools, districts, and organizations across the state using data in innovative ways. Read the first piece on Shamrock Gardens Elementary School here, read the second piece on UNCC’s Institute for Social Capital here, read the third piece on South Rowan High School here, and follow along with the rest of the series here.
From district-wide strategic planning to making real-time decisions about what support students need in classrooms, data cuts across every layer of Rutherford County Schools.
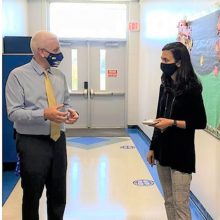
Superintendent Janet Mason sees data as a tool that answers questions, allowing the district, schools, and teachers to operate on evidence rather than assumptions. For Mason, the data is neither good nor bad — rather, it paints a picture of what’s happening in schools and provides an opportunity for reflection. And using data to inform decisions is key to the district’s vision: ensure all Rutherford County students graduate prepared for college and career success.
“We’ve had a cultural shift in our community to understand that in areas where we lag behind, it wasn’t good enough to move forward at an easy pace,” said Mason.
“If we’re going to live up to what we say about providing the type of high quality educational services in this rural area of North Carolina that would compare to anywhere else, the fact that your parents choose to live and work and raise a family here doesn’t negatively impact a child’s outcomes educationally and their ability to access what they want to access in the future — that’s a pretty aggressive vision in a small town, rural place that is a high-poverty district.”
Rather than allow the number of students impacted by poverty in the district to be an excuse for educational outcomes, Mason sees it as a catalyst.
“We understand that their education is key to their future economic prosperity. And I understand that in changing the life of one student, we’re changing the lives of future families as this person goes on to create a family of his or her own in the future,” said Mason.
From the boardroom to the classroom: Data-driven practices at every level
Weaving data into strategic planning and school improvement
Purposeful. Aggressive. Authentic. Those are the core principles of strategic planning for Rutherford County Schools.
In 2014, the Rutherford County Board of Education sat down to develop its five-year strategic plan. Board members discussed the role of data in setting a trajectory for improvement across the district and how data creates accountability. From those conversations, the board decided to ground its 2014-19 strategic plan in student achievement data.
The metrics the board outlined in the plan mirror the metrics used in state and federal accountability models, such as End-of-Grade and End-of-Course test scores, ACT college readiness, and cohort graduation rates. On a state level, these and similar metrics are used by the Department of Public Instruction to assign school performance grades each year.
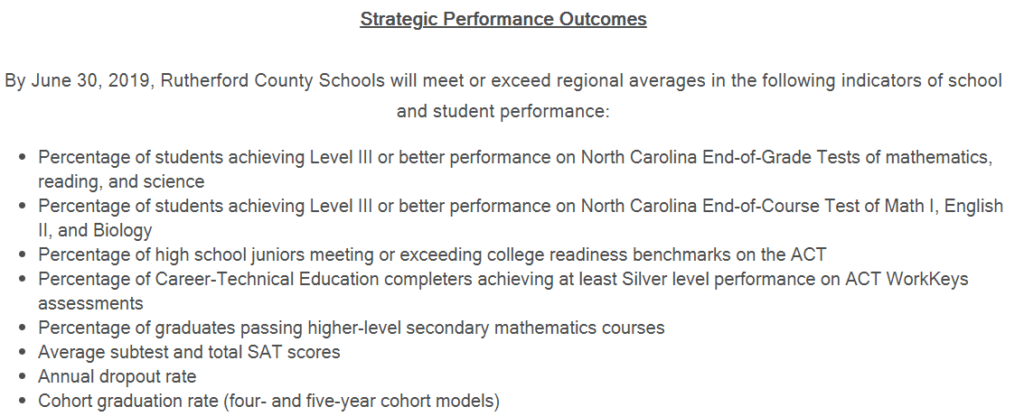
According to David Sutton, the district’s assistant superintendent for curriculum and instruction, the selection of those metrics came from a discussion of both best practices around the use of data and the pragmatic reality that those metrics are already in place to hold schools accountable. This also meant that the local goals of the district were aligned with and connected to state and federal goals.
For Mason, the decision to root the strategic plan in data meant that it wouldn’t just sit on a shelf. Instead, the plan is brought to life during conversations with the board, district leadership, the parent advisory council, the teacher advisory council, and other stakeholders in the community.
“I even shared it with the local board of realtors,” said Mason. “Part of getting our message out is that this school system is focused on improvement and here’s what we’re seeing, and I shared a little bit about the strategic plan and how it drives that focus.”
Mason said one of the most important things the board did was establish the metrics that would be used to hold the school system accountable — but then provided flexibility to the district and schools to determine how to best improve those metrics.
“They didn’t micromanage the process of how to get to those goals,” said Mason. “I believe that the structure of the plan is important, but the way that the board interacts in this process and the way that the board trusts at the same time that they’re holding us accountable is a significant factor in the growth that we’ve seen over the course of that 2014-19 plan.”
Rutherford County Schools
– 18 schools
– Location: Foothills of western NC, including the towns of Forest City, Lake Lure, Rutherfordton, and Spindale
– Enrollment: 7,948 students
– Performance: In 2017-18, 4 schools exceeded growth, 12 met growth, 1 did not meet growth
Similarly, individual school improvement plans are developed on two-year cycles. After the board developed its 2014-19 strategic plan, all 18 schools in the district were able to align their improvement plans to the same metrics and goals, meaning that the schools, the district, the state, and the federal government were focused on the same outcomes.
Just as the board spent dedicated time diving deeply into data, so do the school improvement teams from around the district. During a retreat held every summer at the district office, those teams move through similar protocols that the board moved through, reviewing and analyzing performance metrics for their individual school.
But the process of establishing metrics and tracking outcomes isn’t a one-way street from the school board to the classroom. Rather, it’s an ongoing cycle of feedback between schools, the district, and the board that engages teachers and school leaders along the way. This process creates buy in and ultimately makes having tough conversations about data that much easier.
Kevin Bradley, principal of Chase High School, said the district’s strategic plan and its influence on the school’s improvement plan was crucial in breaking down the silos within his building.
“With the strategic plan, what the focus of our board and our district leadership did was help me as a principal to get my teachers to see school success differently than just that day-to-day classroom success — but how that classroom success contributes to every piece of the school,” said Bradley. “That’s where the strategic plan made such an impact in driving success through looking at the data.”
This process grounded every school’s improvement plan in data and, as Sutton put it, moved the needle on student achievement across the district.
“I think district offices need to be incredibly supportive of schools, but children are not taught in this building,” said Sutton. “They’re taught in classrooms of schools all over the district, and so honestly the real improvement magic happens in classrooms in schools.”
That “improvement magic” shows in the district’s school performance grades. In the 2014-15 school year, roughly 82% of the district’s schools received a C or D on their school performance grade, with the 3 remaining schools receiving a B. By the 2017-18 school year, almost 65% of the district’s schools received an A or B, with the remaining 6 schools receiving a C. For comparison, only 36% of schools statewide received an A or B performance grade that year.
Now, the school board is in the process of developing its next strategic plan. During a retreat in February, board members and district leaders engaged in a deep dive on the student achievement metrics used in their previous strategic plan, including a break down of how the district’s metrics compared to the region and the state over time. The board also reviewed qualitative findings from district-developed surveys given to a wide variety of stakeholders, including parents, local business partners, and county officials.
“They were given a data-rich perspective on what the voices of our local community have to say about priorities, expectations, and ambitions for our local school systems,” said Sutton.
Diving deep on dropouts
Mason remembers how high the district’s annual dropout rate used to be in the 1990s. That’s around the time Mason first joined the district and worked as a mentor with a group of students at risk of dropping out.
Recently, the district had to cut jobs due to decreased funding. But, in her role as superintendent, Mason was able to make the case for why the district should keep their graduation coaches — a case she couldn’t have made without the right data at her fingertips.
Mason points to this scenario as the best illustration of the power of data.
“To me, that’s what data does — it identifies the problem, it helps maybe even identify a solution or helps you craft a solution, and it translates into a service that’s a hands-on practice with students or their families,” said Mason.
Now, the program has expanded, with one graduation coach at each of the district’s traditional high schools and an increase from one social worker for the entire district to three. In addition to mentorship programs, the district began to closely monitor the profile of its dropouts around the 2013-14 school year.
According to Renee Collins, director of secondary education, the district was interested in collecting and analyzing information to determine who was dropping out and why. With that in mind, the district created its own dropout data collection record that functions like an exit survey for students who decide to drop out. The survey asks about demographic information, reasons for withdrawal, which schools the student attended, specific courses they attempted but failed, interventions or support services they received or attempted to receive from the school, extracurricular activities they were involved in, and more.
While some of the information the survey collects is available in the state’s student information system, PowerSchool, much of it isn’t. And, according to Sutton, even the information available in PowerSchool wouldn’t be aggregated and digestible in the same way that the district maintains its data from the dropout surveys.
“We know in real time what student attendance and discipline patterns look like. We know in real time what courses students are passing. We know common stumbling blocks. We know how many credits kids have today,” said Sutton. “So we need to not just be smart about using the data we inherit — we need to be agile about using the data we create.”
After administering the survey, the student services team unpacked the data by working through 12 different questions, such as: “Are there specific high school courses that appear to present common or pervasive academic obstacles among local dropouts? If so, what are those courses, and what hypotheses may help to explain the phenomenon?”
Rather than operating on assumptions and stereotypes about what dropouts look like, this data-driven process allows schools to ground themselves in the reality of the students they are currently serving.
“Now, we have an understanding as to what Rutherford County Schools dropouts look like, and we know that these are the students we need to intervene with early when we start seeing these indicators — failure of Math I, failure of English I, an excessive number of transfers,” said Collins.
Graduation coaches and student services teams at each school look for those early indicators and work with individual students to connect them to the support they need inside and outside of school to walk across the graduation stage.
Looking at a chart of the annual dropout rate over the last decade in Rutherford County, the impact of this work jumps off the page. In the 2007-08 school year, the district’s annual dropout rate was 6.27% compared to a state average of 4.97%. In the 2017-18 school year, the state average dropped to 2.18%, and the district’s annual dropout rate dropped to 2.2% — a 65% decrease from where it stood a decade before.
MTSS: Supporting the whole child through data-driven practice
While Rutherford County Schools aligned its strategic plan and school improvement plan outcomes with those of state and federal accountability models, those academic metrics aren’t the only thing the district and schools rely on to make decisions. Multi-Tiered System of Support, or MTSS, is one of the ways the district incorporates data to address the needs of the whole child.
Implemented in all 10 elementary schools in the district, MTSS uses data to create multiple tiers that ensure students receive the level of support they need to be successful in the classroom both academically and behaviorally.
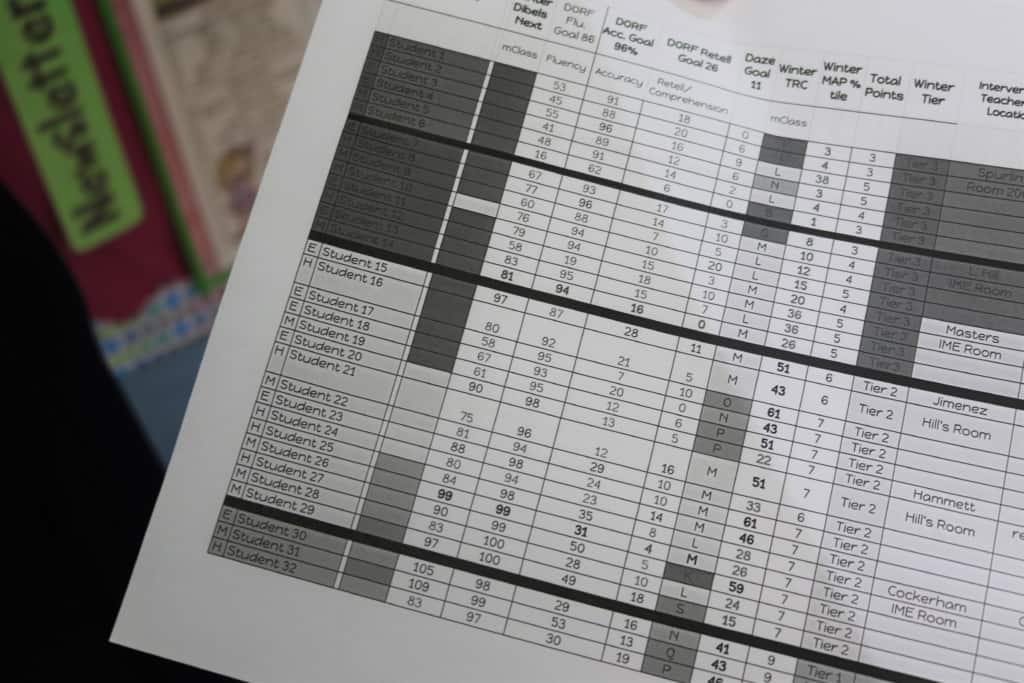
On the academic side, universal screening assessments for reading and math are administered three times a year to students in each grade level. Then, cut points are set to group students into three tiers based on their scores. Tier 1 (green) is for students on or above grade level, tier 2 (yellow) is for students slightly below grade level, and tier 3 (red) is for students significantly below grade level.
For grades K-3, several measures are used to determine reading tier placements, including the Dynamic Indicators of Basic Early Literacy Skills (DIBELS) and the Text Reading Comprehension (TRC) components of mClass, and Measures of Academic Progress (MAP) assessments. Grades 4-5 use only MAP assessments for reading tiers, and grades K-5 use MAP assessments for math tiers.
During the first weeks of school, students take their first assessment. Data from those assessments are used to group students into tiers, down to the individual sub skills that they need to strengthen. Then, from September to December, students engage in the first session of intervention and enrichment around those skills. In January, the students take a second assessment. That data is used to create new tiers for session 2, which runs through May. Teachers also analyze this data to see how students progressed between session 1 and session 2.
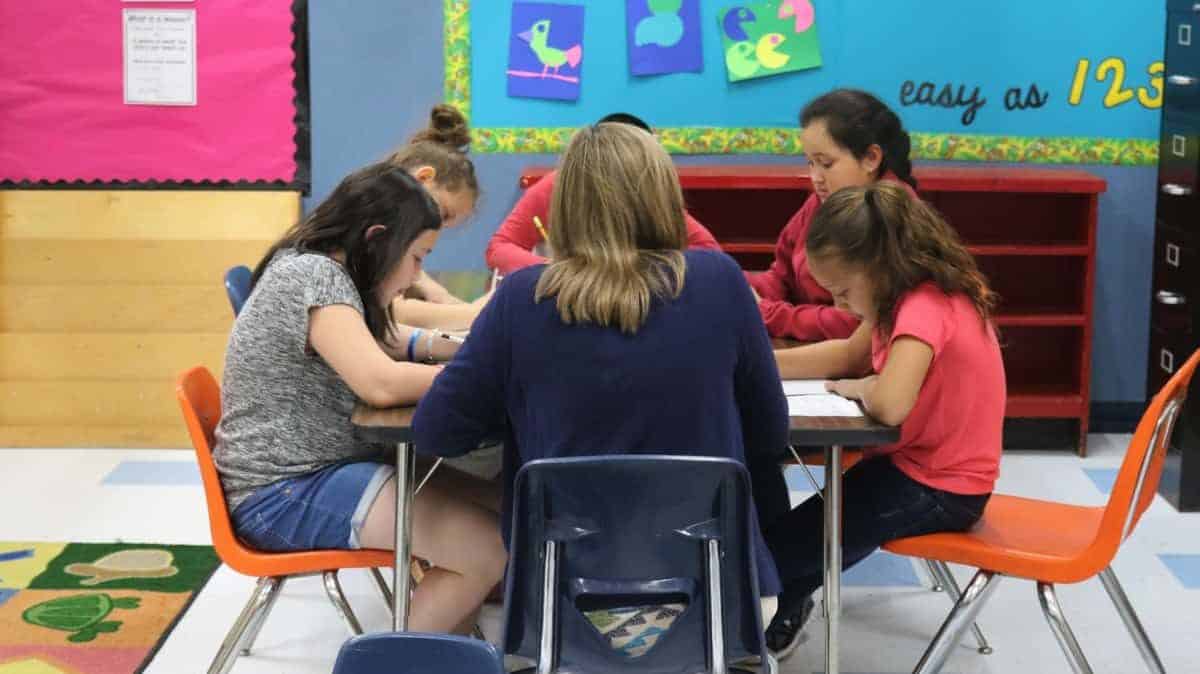
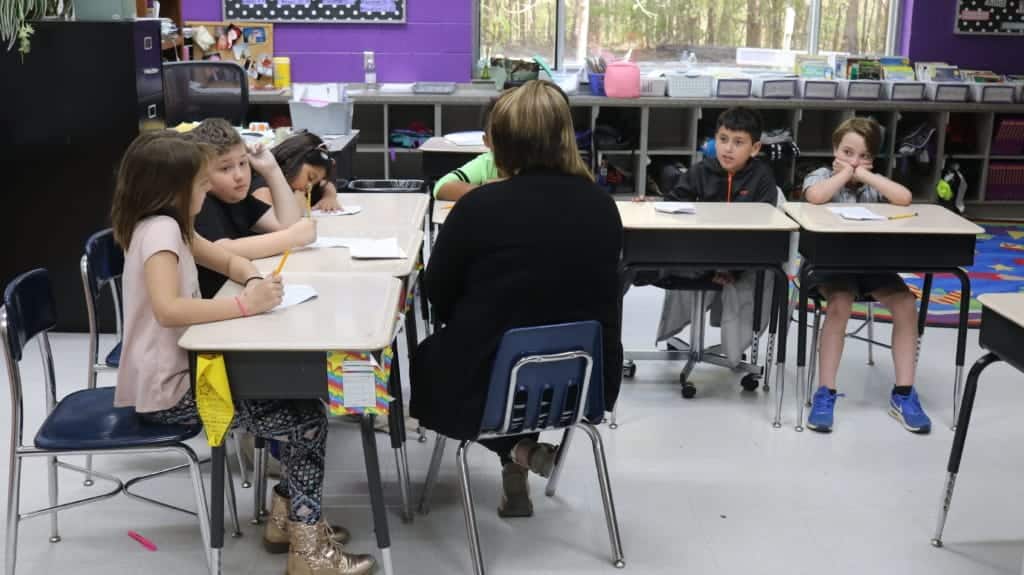
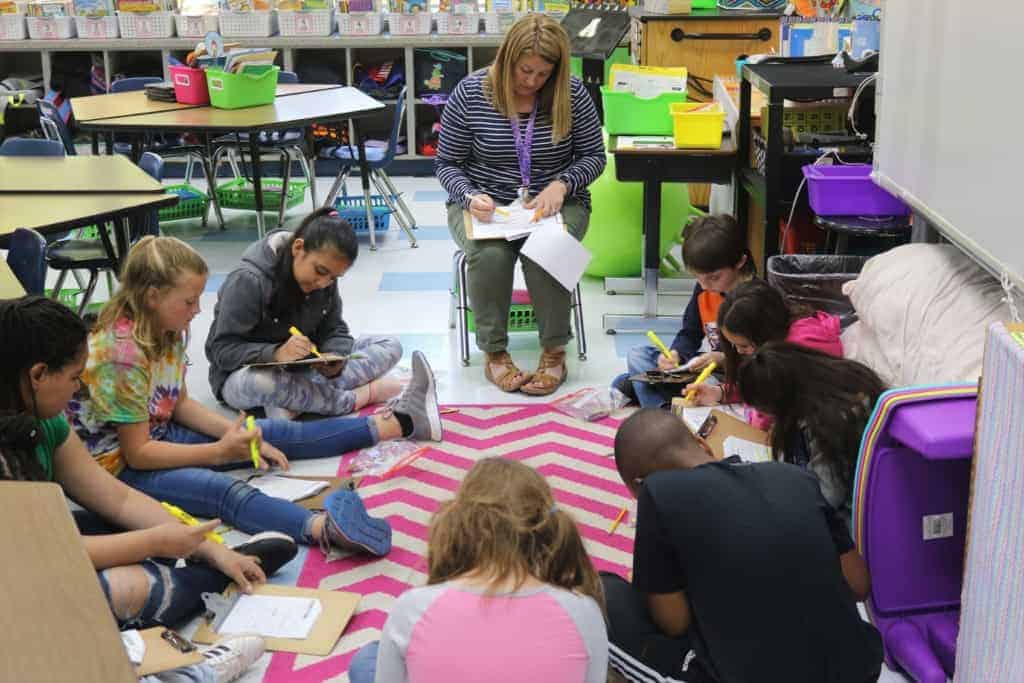
While all students receive the same daily core instruction, there’s a dedicated hour built into every day for extra intervention and enrichment. During that time, students split into small groups based on their tier and work with teachers on specific skill sets they need to strengthen.
“The ultimate goal is to use that information to help students be successful and to reach grade level expectations,” said Tammie Ash, principal of Forrest Hunt Elementary School. “Because if those students don’t catch up at a rate faster than their peers, they’re never going to catch up.”
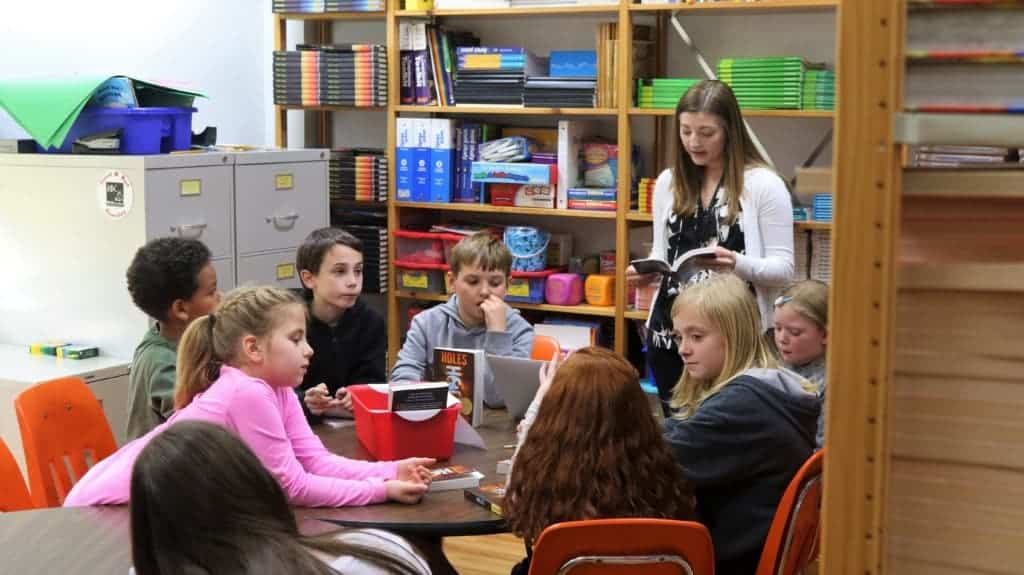
The typical size of groups during intervention and enrichment time is about five or six, allowing students to receive more one-on-one attention than they would during traditional instruction. In one room, a tier 1 small group could be working on a guided reading of an advanced novel. Down the hall, a tier 2 small group could be focusing on fluency and accuracy. During this time, tier 1 and tier 2 students receive 30 minutes of reading instruction and 30 minutes of math instruction, while tier 3 students receive one hour dedicated to their lowest skill.
On the behavioral side, discipline data on referrals are used to determine which students need extra behavioral support beyond their core instruction. While there’s not a dedicated time of day for behavioral support like there is for academics, students may receive interventions in small groups with a counselor or engage in a strategy called “check in, check out” where they speak with a teacher or staff member at the beginning and end of each day to discuss expectations and feedback. Students that fall into tier 3 for behavioral supports may receive an individualized behavior plan or be connected with community partners who offer other wraparound services.
Once a week, teachers engage in data meetings with their grade level teams to monitor and review the individual needs of their students. They work to identify what they’re doing right and what needs to change to ensure more students are on grade level. They consider factors like curriculum, scheduling, and other supports that students may need to be successful.
Then, they progress monitor to determine if the interventions are making a difference for tier 2 and tier 3 students. Specific student sub skills are graphed in a tool that allows teachers to see how every student in their intervention group is progressing. After several months, if an intervention is successful in increasing the skills of every student in a group except for one, teachers would work to gather more data on that student and consider if they should be referred to other supports within the school or community.
Teachers also take the time to progress monitor the grade level as a whole to determine what percent of students are on, slightly below, or significantly below grade level. The school’s goal is to have at least 80% of students on grade level.
“If you’re looking at core instruction, we would say we have 70% of our fifth grade math students on grade level according to this assessment. Then we would ask ourselves: Is it a gap in our curriculum, is it the time of day that we’re teaching this, do we need to adjust this in our schedule, do they have a break during their core?” said Ash. “We are looking at what we can put in place to make sure that this improves.”
Patrice Brown, a fifth grade math teacher at the school, reviews data on each of her 68 students to determine which sub skills they need more instruction on, whether that be numbers and operations, geometry, measurements and data, or something else. Then, she gathers resources for her MTSS intervention to ensure students work on those specific skills. The goal is that existing gaps in sub skills shrink over time.
“I use this [data] a lot. I look at it a lot when I’m planning my calendars,” said Brown. “And then I always go back to the first and second session to see if they grew — if they were red in a sub skill, I want to make sure in the second session that it’s not recurring, or have they grown in that sub skill?”
Over the next few years, the district plans to lay the foundation for scaling MTSS to middle and high schools, which will involve discussions around what data to monitor and track. In the elementary school setting, fundamental skills like reading and math are closely monitored. In a high school setting, those indicators would need to also monitor students’ progress towards on-time graduation, such as which credits they’ve obtained and how many days of school they’ve attended.
While middle and high schools across the district are already tracking many of those factors, Collins believes they could learn a lot from the progress monitoring system used within MTSS in the elementary schools.
The plan is still in its infancy, but the district ultimately hopes to design a dashboard that would provide a real-time assessment of where high school students stand on their path to a four-year graduation — including behavioral data, attendance data, and academic data. Sutton hopes that tool would provide real-time, actionable insights to help schools figure out which groups of students need particular supports.
“Once we have all the details ironed out, we’ve got a foundation ready to build on [MTSS] at Chase High, and it’s due largely because of the district strategic plan and how that’s influenced school improvement,” said Bradley.
For all its work around data, Rutherford County Schools retains its focus on the real purpose behind the numbers: empowering teachers to do better for their students and improving outcomes for kids.
“There’s this cerebral analytics data element to it, but at the end what it translates to is my work with you person to person is better informed and more focused than it’s ever been,” said Sutton. “And ultimately, if all this work isn’t making us better in engaging with people, meeting them where they are, and supporting them every day, then there’s really no point.”