Meeting an established standard of college and career readiness is important for all high school students, regardless of postsecondary intentions. Whether navigating the collegiate environment or the workforce, graduates must have the necessary cognitive and behavioral skills to succeed.
For students with postsecondary intentions, readiness benchmarks help to indicate whether a student will be able to adequately complete entry-level college coursework without remediation. This is important, as research indicates that remedial education does not consistently increase the likelihood of college success.1 In some instances, it was found to be potentially detrimental to student persistence and graduation.2 Remediation also lengthens a student’s postsecondary program, as remedial coursework typically does not count as credit toward a degree or nondegree credential, increasing the likelihood that a student may experience financial constraints that delay or prevent completing the program.
Meeting readiness benchmarks also benefits students who intend to transition more directly into a career following high school graduation. Historically, well-paying jobs for individuals without a college degree have been in blue-collar career fields. As the employment landscape becomes increasingly knowledge-based, however, the majority of job seekers will need some level of academic training beyond high school.3 Skilled-service industries, such as health services, finance, and information technology, are expected to become the largest well-paying employment sectors for individuals without a four-year degree. Many of these occupations require a nondegree credential or associate degree, and students must be adequately prepared for their vocational or associate degree program.4
Indicators of College and Career Readiness
In North Carolina, college and career readiness is defined as proficiency in college-level English and mathematics courses without need for remediation. This standard is comprised of a set of benchmarks for course completion and test performance to gauge student proficiency.
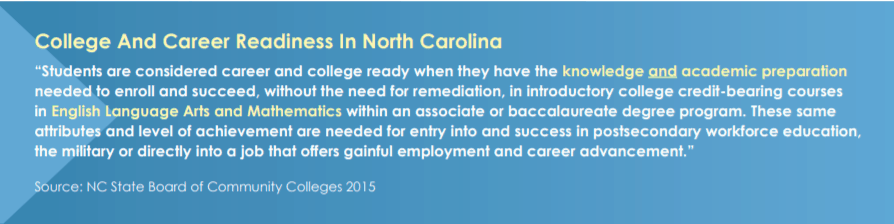
To be considered college and career ready, NC graduates must first complete the NC Standard Course of Study:
- Four credits in English language arts
- Four credits in social studies
- Four credits in mathematics (including Math I, II, and III)
- Three credits in science
- One credit in health and physical education
- Six elective credits5
In addition to this curriculum requirement, graduates must also achieve at least one of the following three metrics:
- Achieving a passing-level score or satisfactory level in reading, writing, and mathematics on the SAT, ACT, NC Diagnostic Assessment and Placement (NCDAP) exam, or an approved alternative
- Achieving a passing-level score on the ACT WorkKeys Career Readiness Assessment (for Career and Technical Education completers)
- Attaining a high school grade point average (GPA) that meets institutional thresholds for collegecourse placement
In this report, college and career readiness will be assessed with standardized test results and survey data from ACT, Inc. Although other metrics are used in conjunction to measure college and career readiness, such as high school GPA, this evaluation is limited to publicly available data.
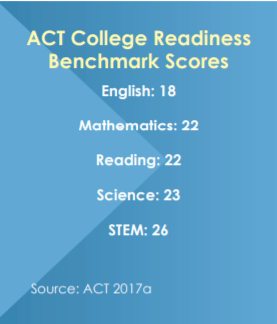
Since 2013, the ACT standardized test has been administered to all eleventh graders in North Carolina. The ACT exam consists of four subject tests—English, mathematics, reading, and science—that each have a college readiness benchmark.6 These benchmarks, established by ACT, Inc., were developed based on the performance of first-year college students and represent the score associated with an increased likelihood of achieving a grade of C or higher in related introductory first-year college courses.
How is North Carolina performing?
Few NC students met all four ACT benchmarks
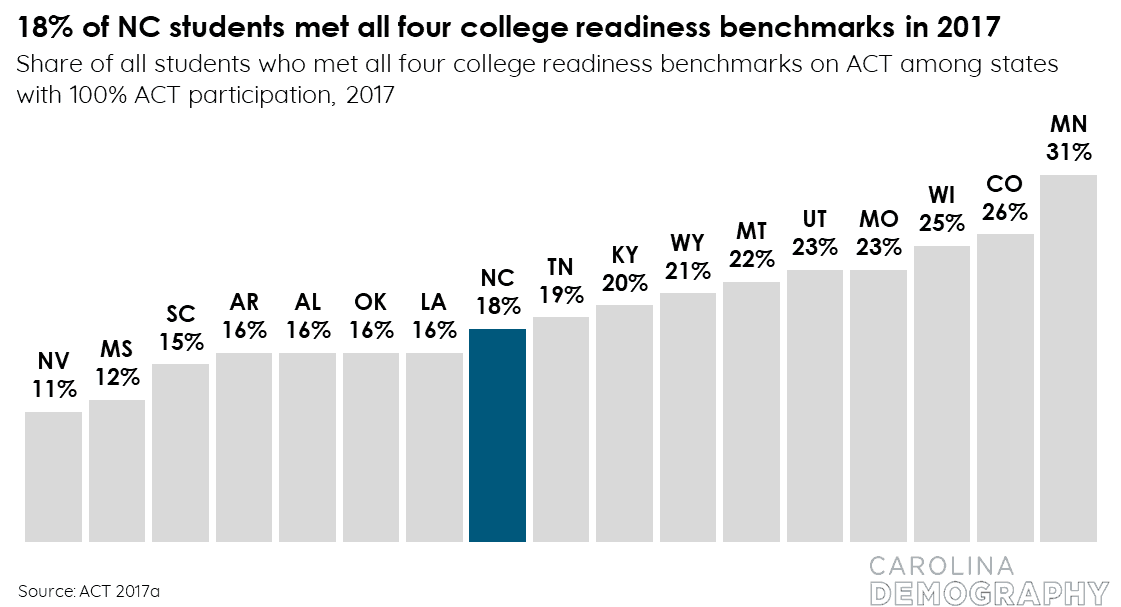
Eighteen percent of North Carolina’s public high school graduating class of 2017 met all four ACT benchmarks in English, mathematics, reading, and science, an improvement of one percentage point from 2013 (17%). More than twice as many students (47%) met none of the ACT benchmarks, a slight improvement from 49% in 2013.
North Carolina is one of seventeen states that administers the ACT exam to all eleventh-grade students. Figure 17 displays the share of students meeting all four college readiness benchmarks in each of these seventeen states in 2017. Minnesota had the highest share of students meeting all four benchmarks (31%), and Nevada had the lowest (11%). North Carolina ranked tenth out of seventeen for the percentage of students meeting all four benchmarks (18%). Compared with neighboring states, North Carolina’s rate exceeded South Carolina’s (15%) by three percentage points but was below Tennessee’s (19%) by one percentage point.
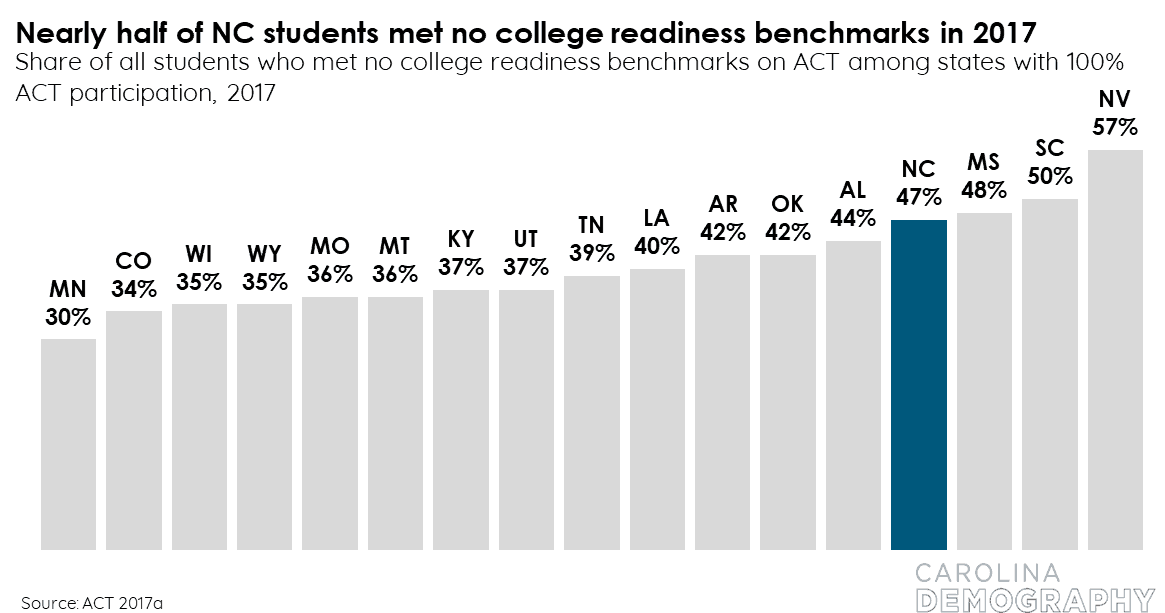
In contrast, nearly half of NC students met no college readiness benchmarks (47%), the fourth highest share among these seventeen states, as shown in Figure 18. This was three percentage points lower than neighboring South Carolina (50%) but eight percentage points higher than Tennessee (39%). Nevada had the highest share of students meeting no benchmarks (57%), while less than one in three Minnesota students met no college readiness benchmarks in 2017 (30%).
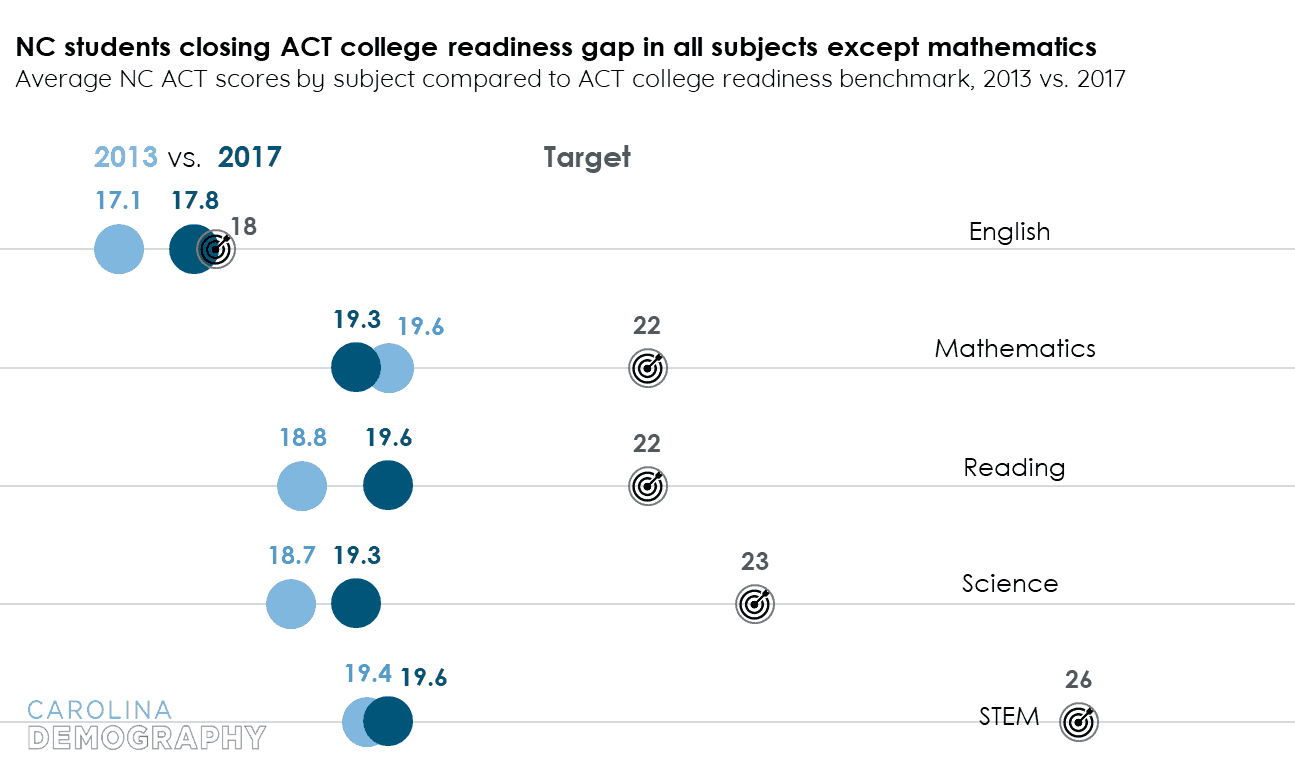
Gap between average ACT scores and readiness benchmarks closed in all subjects except mathematics, though large disparities remain
NC public high school graduates’ average ACT subject scores rose from 2013 to 2017 in all subjects except mathematics.7 However, gaps persist between the state average scores and their respective benchmarks, as shown in Figure 19 8 The following are specific changes in ACT subject scores as of the 2017 ACT exam:
- Students earned an average score of 17.8 in English, nearly meeting the readiness benchmark in this subject (gap of 0.2 points). This marks an overall improvement of 0.7 points since 2013.
- The average score in mathematics worsened by 0.3 points, dropping from 19.6 in 2013 to 19.3 in 2017. Nationally, the average mathematics score also declined over this period, dropping by 0.2 points. The gap between NC graduates’ average score and the mathematics benchmark was 2.7 points in 2017.
- The greatest improvement took place in reading, which improved by 0.8 points, rising from 18.8 in 2013 to 19.6 in 2017. This represents a gap of 2.4 points from the reading benchmark score.
- Science scores saw an improvement of 0.6 points, rising from 18.7 in 2013 to 19.3 in 2017. Despite this improvement, a gap of 3.7 points remains between the science benchmark and state average scores.
- The largest disparity exists between average scores in Science, Technology, Engineering, and Mathematics (STEM) and its benchmark.9 While average scores have improved by 0.2 points from 19.4 in 2013 to 19.6 in 2017, the gap stands at 6.4 points.
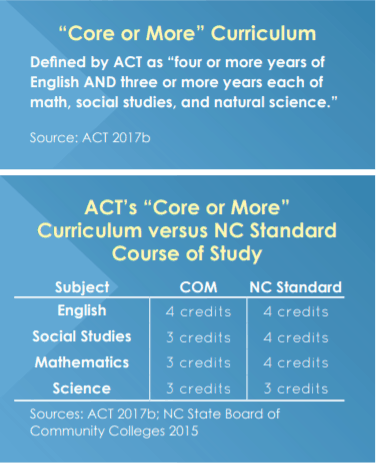
Fewer NC students are taking a “Core or More” curriculum
Fewer NC public high school students are taking a course load associated with success in college. In 2013, 62% of high school graduates reported taking a “Core or More” (COM) curriculum at the time of testing. Five years later, this share had declined by three percentage points to 59% of students.10
A COM curriculum suggests a higher likelihood of success in introductory college courses, as indicated by the higher average scores of these graduates on the ACT exam. In 2017, average scores among NC high school graduates meeting COM status in a given subject exceeded “Less than Core” (LTC) students’ average scores by anywhere from 3.9 points (science and mathematics) to 5.3 points (English), as shown in Table 4.
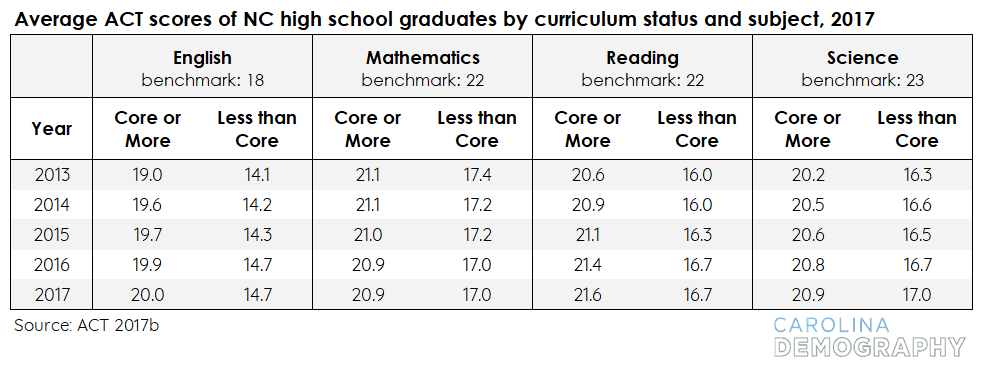
However, average 2017 scores among COM students still failed to meet college readiness benchmarks in three out of four subjects: reading (under by 0.4 points), mathematics (under 1.1 points), and science (under by 2.1 points). The average score in English exceeded the benchmark by 2 points.
For students taking LTC coursework, the gaps between graduates’ average scores and the college readiness benchmarks were significantly larger. Among LTC graduates, the average score in
- English was 14.7, below the subject benchmark by 3.3 points;
- mathematics was 17.0, below the subject benchmark by 5.0 points;
- reading was 16.7, below the subject benchmark by 5.3 points; and
- science was 17.0, below the subject benchmark by 6 points.
Additionally, the average score in mathematics for both groups of students declined from 2013 to 2017. COM students saw a decrease of 0.2 points (approximately 1%), while LTC students saw a 0.4 point (2%) decrease.
These data indicate the relative importance of a rigorous curriculum, as COM students perform measurably better on the ACT exam than LTC students. School counselors and administrators may use this information when guiding students through the annual course selection process. However, exposure to a core curriculum does not always equate to adequate exam performance, and other factors must be explored as tools in increasing college readiness.
Demographic Differences
Figure 20 shows that, among the state’s largest racial/ethnic minority groups, fewer than one in ten high school graduates met all four ACT college readiness benchmarks in 2017: 9% of Hispanic students met all four benchmarks, followed by 6% of American Indian students and just 4% of the state’s Black students. In comparison, 27% of White students and 38% of Asian students met all four benchmarks.
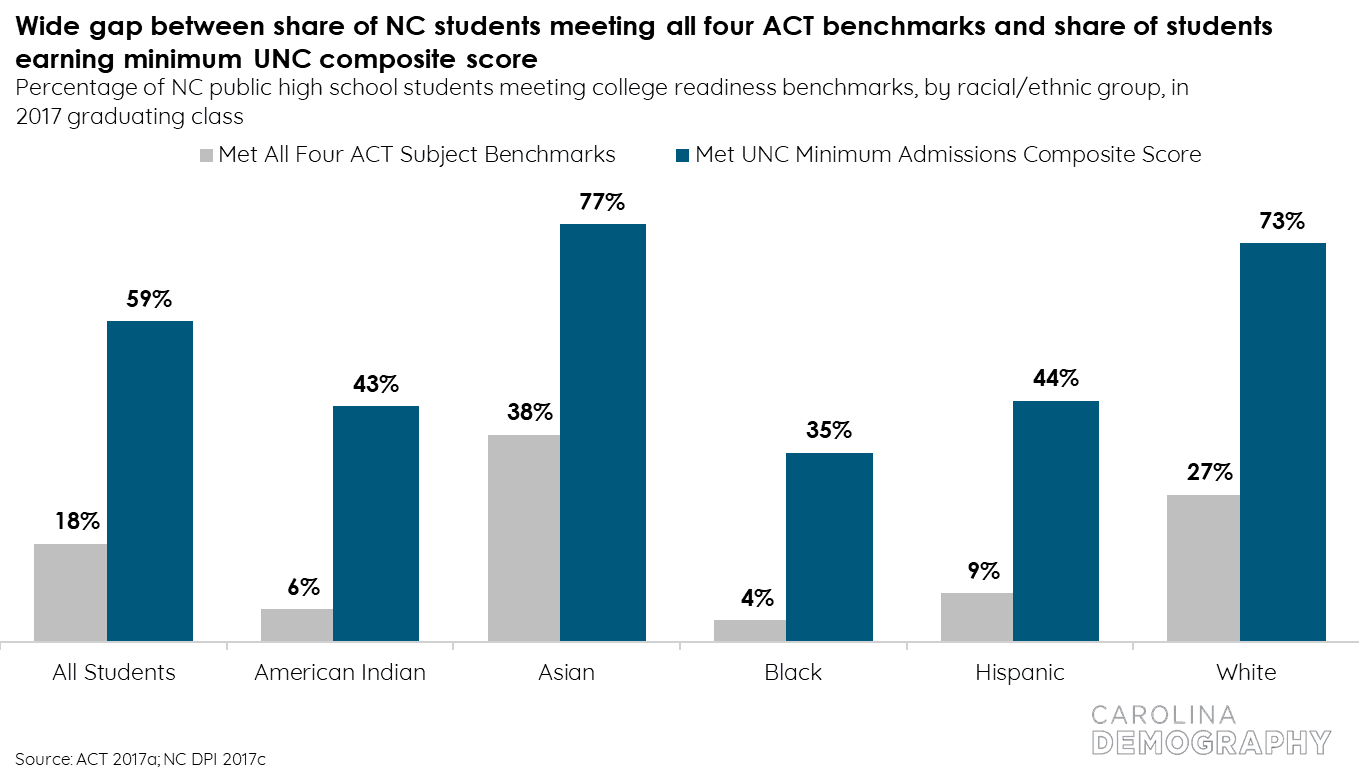
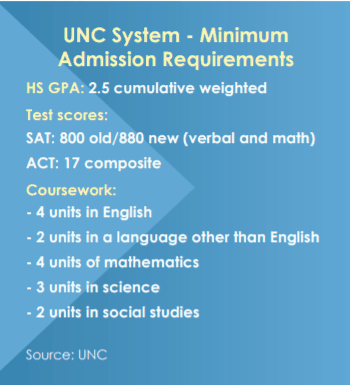
On the other hand, the percentage of students who earned the minimum ACT composite score eligible for admission into the UNC system was much greater.11 Over half of all students (59%) earned the minimum composite score in 2017, and at least one-third of every demographic subgroup earned the minimum composite score, ranging from 35% of Black students to 77% of Asian students. Using one composite score in admissions can help offset students’ weaknesses in one subject with strengths in another. However, it also raises the question of whether college readiness in all four subjects is necessary for college entry and success.
The impact of COM curriculum on ACT exam performance varied across racial/ethnic groups
Students of all racial/ethnic subgroups performed better on the ACT exam when exposed to a COM curriculum versus students of the same group who took an LTC curriculum. Figure 21 displays the share of North Carolina’s 2017 high school graduates who met three or four college readiness benchmarks by curriculum status and racial/ethnic group. Overall, 40% of COM-status students met three or four ACT college benchmarks compared with just 10% of LTC-status students, a fourfold increase. While all students performed better when exposed to the COM curriculum, the impacts of a college-ready course load on ACT performance varied by racial/ethnic group.
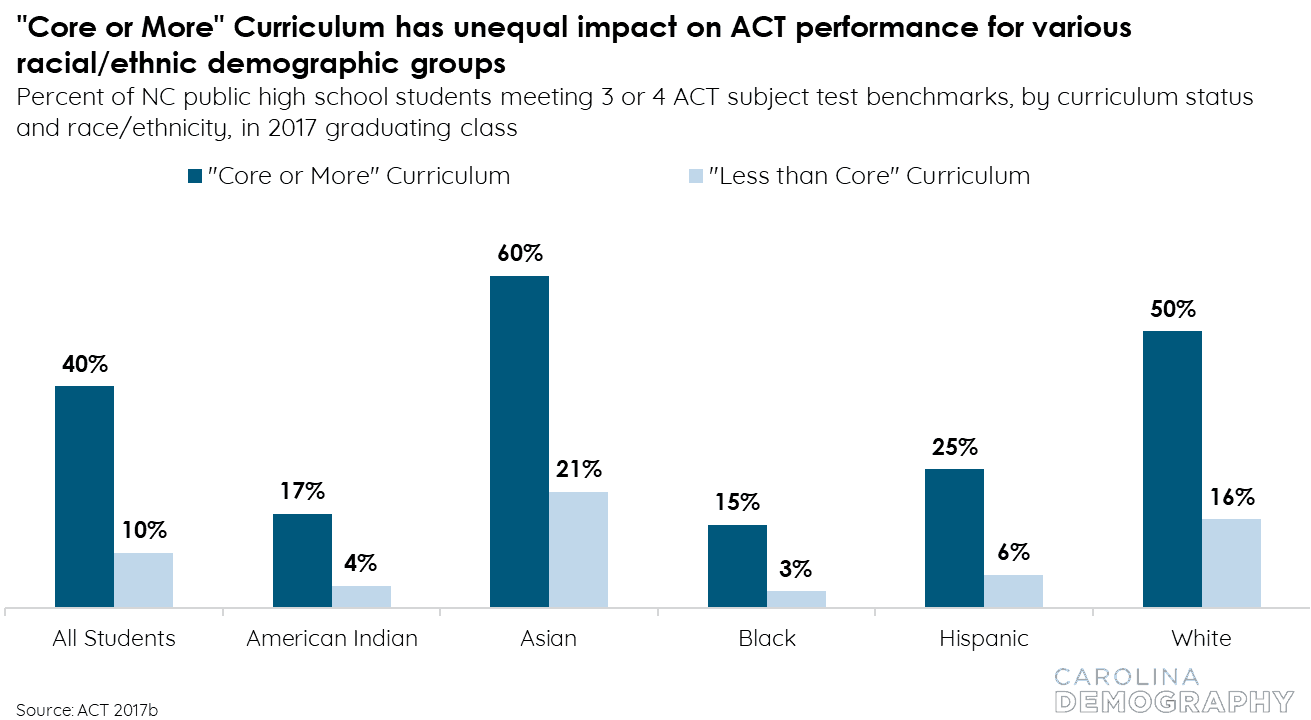
Asian students, for example, outperformed all other racial/ethnic subgroups within each curriculum status group. They also had the largest absolute returns to core curriculum coursework: 60% of COM-status Asian students met three or four benchmarks compared with 21% of LTC-status Asian students. While this threefold increase was a smaller percentage increase than the state average return to COM-status, the absolute increase in performance—39 percentage points—was the largest gap among any racial/ ethnic subgroup by curriculum status.
However, just 3% of LTC-status Black students met three or four benchmarks compared with 15% among COM-status Black students. While this was the largest relative increase of any group—the rates of benchmark attainment among corecurriculum students were five times the rate of their non-core-curriculum peers—this represents an absolute increase of just ten percentage points, and performance of these students continued to lag other racial/ethnic groups.
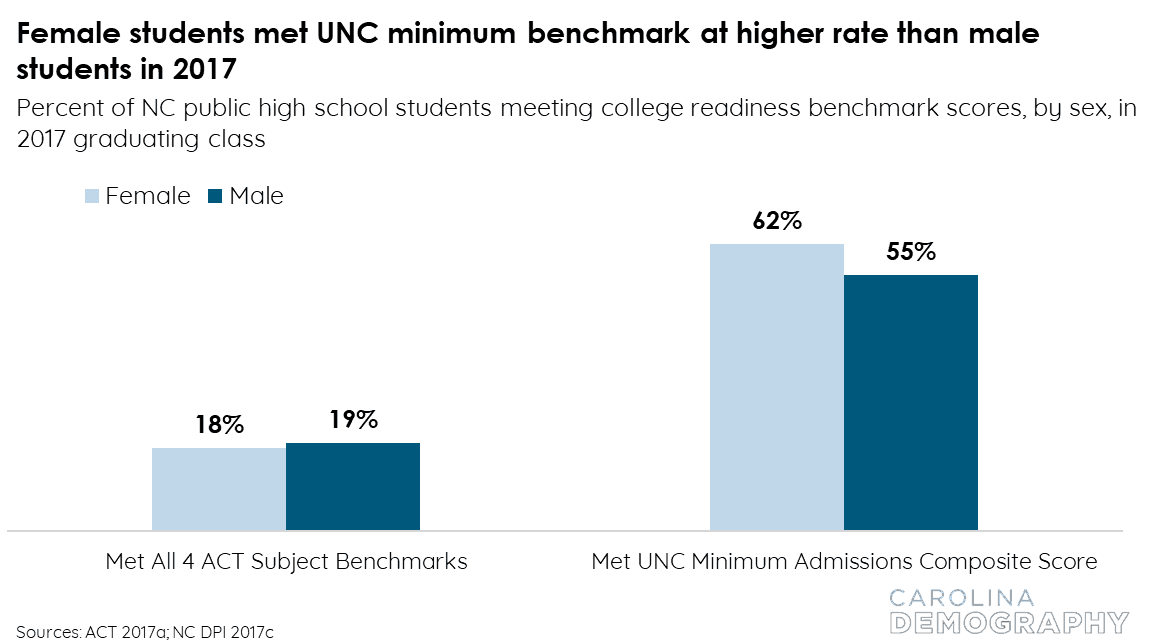
Similar share of female and male students met all four ACT benchmarks, but more female students met UNC minimum admissions benchmark
Fewer than one in five female or male students met all four benchmarks on the 2017 ACT exam, as shown in Figure 22. The share of male students meeting all four benchmarks on the 2017 ACT exam (19%) was just one percentage point higher than the share of female students (18%). The disparity between the sexes was much greater regarding the percentage earning a UNC minimum admission benchmark score. Sixty-two percent of female students earned a qualifying score, seven percentage points higher than male students (55%).
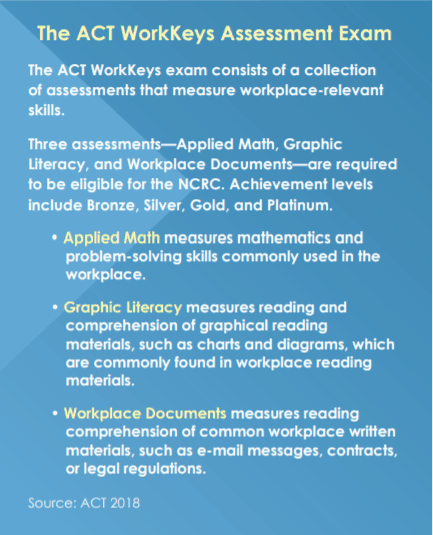
Measuring Career Readiness
The ACT WorkKeys Assessment exam is a collection of job skills assessments12 and help measure the workplace skills that can affect job performance.” For more information, see ACT (2018).] administered to students in North Carolina who completed or are expected to complete a four-course Career and Technical Education (CTE) sequence prior to graduation.13 CTE students complete the standard high school curriculum, with the CTE component fulfilling part or all of the six-credit electives requirement.14 The National Career Readiness Certificate (NCRC) requires the completion of three assessments: Applied Math, Graphic Literacy, and Workplace Documents. Achievement levels on the NCRC range from Bronze to Platinum and test takers are generally considered career ready if they earn Silver level or better.
Nearly three-fourths (73%) of all CTE graduates in North Carolina earned a Silver certificate or better on the ACT WorkKeys exam in 2017, as shown in Figure 23. Among the 2017 graduates, Asian graduates had the highest share of CTE completers earning a Silver or higher (83%), followed by White students (81%), Hispanic students (72%), American Indian students (65%), and Black students (57%).
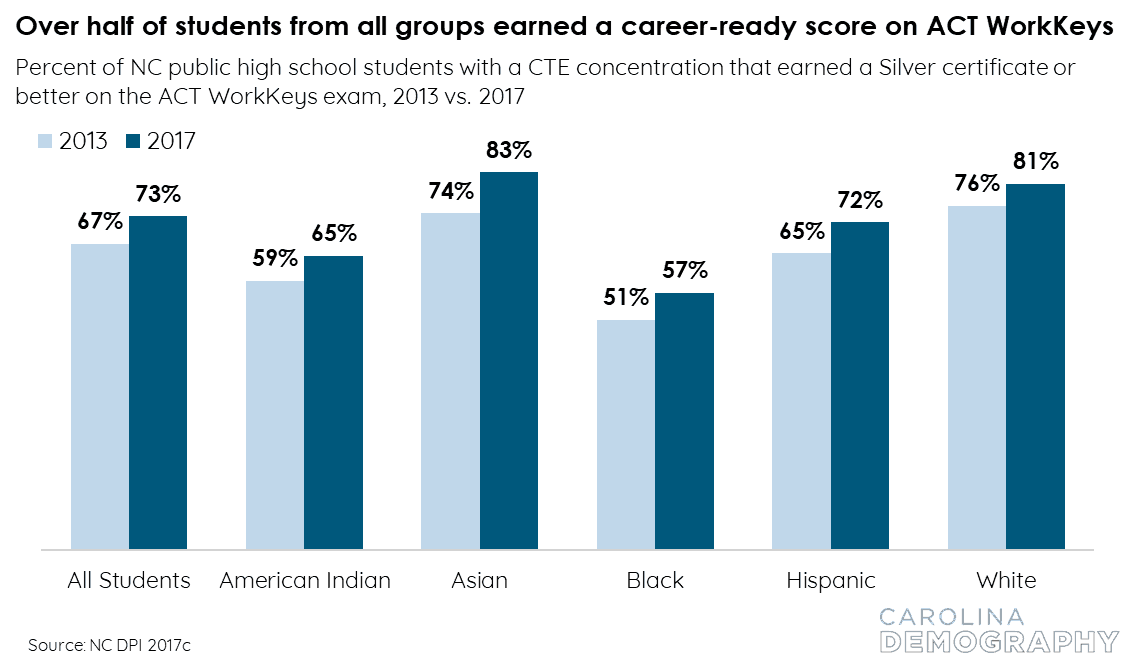
All groups had large increases in the share of Silver certificate earners from 2013 to 2017. The overall share of CTE completers earning a Silver or better grew six percentage points, rising from 67% in 2013 to 73% in 2017. Over this same period, the number of CTE completers grew from 32,000 to 36,000. Combined with higher rates of Silver certificate attainment, the overall number of Silver certificate earners grew from just over 21,500 in 2013 to 26,400 in 2017, an increase of 4,900 (23%).
Similar increases in the share of CTE completers earning a Silver certificate or higher were seen for all racial/ethnic groups:
- Five percentage points for White students (from 76% to 81%), the smallest increase of any group
- Six percentage points for American Indian (from 59% to 65%) and Black (from 51% to 57%) students
- Seven percentage points for Hispanic students (from 65% to 72%)
- Nine percentage points for Asian students (from 74% to 83%), the largest increase of any group
Pipeline Takeaway
Eighteen percent of graduates met all four college readiness benchmarks on the ACT exam; nearly half met none
The share of graduates meeting all four benchmarks on the ACT exam was 18% in 2017, an improvement of one percentage point from 2013 (17%). More than twice as many students (47%) met none of the ACT benchmarks, a slight improvement from 49% in 2013.
Compared with other states with 100% ACT exam participation, North Carolina ranked tenth out of eighteen in terms of its share of students meeting all four benchmarks in 2017. On the other hand, it had the fourth largest share of students meeting zero benchmarks.
Gaps between state average ACT scores and readiness benchmarks closed in all subjects except mathematics, though large disparities remain
NC public high school graduates’ average ACT scores rose from 2013 to 2017 in all subjects except mathematics. However, gaps persist between the state average scores and their respective benchmarks. In English, the 2017 average score nearly met the subject benchmark (gap of 0.2 points). This was followed by reading (gap of 2.4 points), mathematics (gap of 2.7 points), science (gap of 3.7 points), and STEM (gap of 6.4 points). In mathematics, the readiness gap grew from 2.4 points in 2013 to 2.7 points in 2017.
Groups with largest improvements on ACT were already above average
At 38%, Asian graduates were the most likely to meet all four benchmarks on the ACT exam. This was followed by White (27%), Hispanic (9%), American Indian (6%), and Black (4%) graduates. These rates were higher for all groups compared with 2013, with Asian graduates experiencing the largest increase (8 pp) followed by White graduates (4 pp). As a result, the gap between the highest-performing and the lowest-performing racial/ethnic group widened from twenty-seven percentage points in 2013 to thirty-four percentage points in 2017.
Editor’s note: The Belk Endowment supports the work of EducationNC. To read the full report and view the data, visit ncedpipeline.org.